Tesla Beat Deliveries by 74,000 Vehicles — and Fell 7%. What the Chart Is Telling Traders
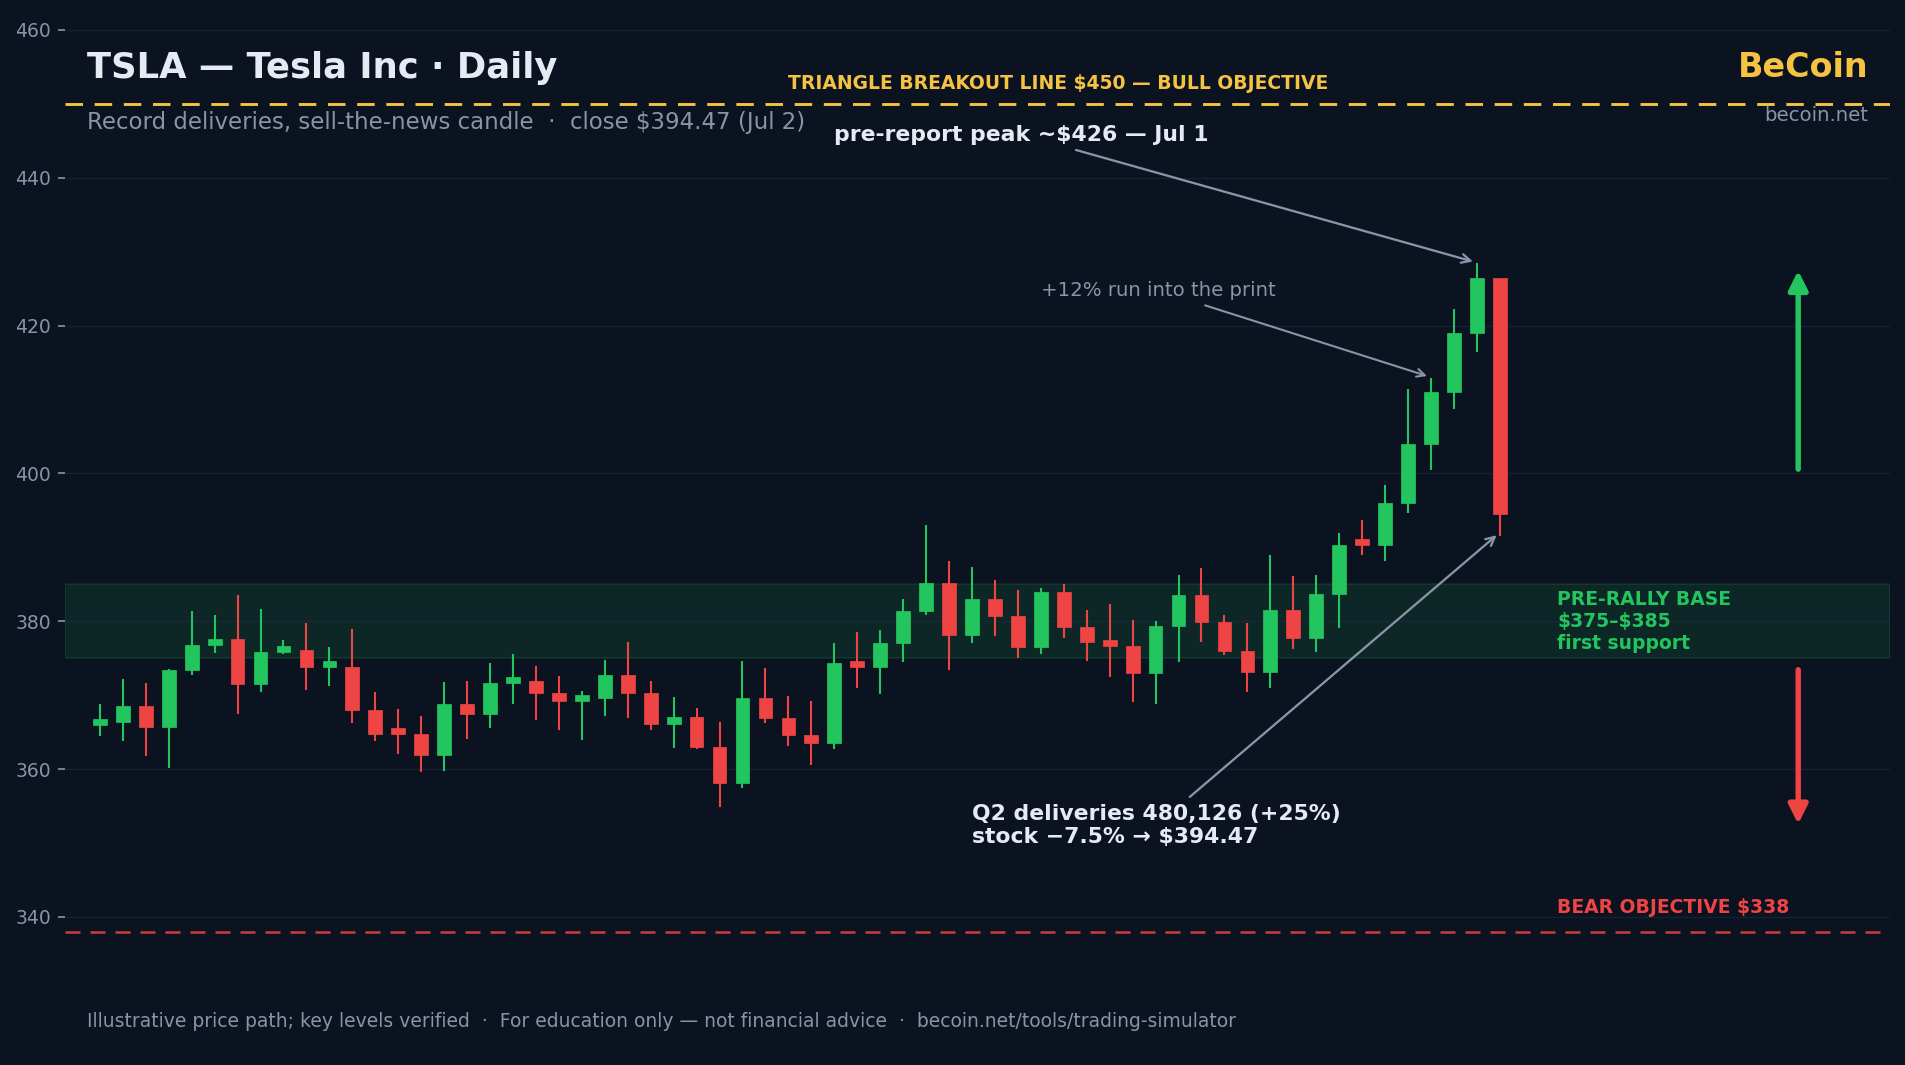
On paper, July 2 should have been a celebration at Tesla. The company delivered 480,126 vehicles in the second quarter — up 25% year over year, roughly 74,000 more than Wall Street expected, an 18% beat on consensus. China wholesale deliveries surged 33%. And the stock… dropped 7.49% to $394.47, its worst single day in nearly a year.
"Good news, red candle" is one of the most instructive events in markets. Here is why it happened, what it says about how Tesla is now being priced, and the levels traders are working with after the damage.
The Setup
The first clue was in the run-up: Tesla shares rallied roughly 12% in the week before the report. By the time the delivery number hit the wire, a blowout was no longer a surprise — it was the position. When everyone who wanted to buy the number has already bought it, even a beat leaves no marginal buyer, and the exit gets crowded fast. Classic sell-the-news.
The second clue is what investors are actually pricing. As several analysts framed it, volume is no longer the variable that matters: the question is whether Tesla can move record numbers of cars without compressing per-vehicle economics. A delivery beat achieved amid pricing pressure doesn't answer the margin question — it sharpens it. Layer on a valuation in the hundreds of multiples (about 421x trailing earnings) and expiring US federal EV tax credits, and the bears had plenty of material to work with even on a record day.
There's also a sentiment wrinkle unique to this stock: the SpaceX IPO. Musk's rocket company listed on June 12 as SPCX in the largest IPO in history (~$75 billion raised). Bulls had treated the event as halo-effect fuel for Tesla; with the IPO now done, one more speculative catalyst has moved from "upcoming" to "spent."
Key Levels to Know
- ~$426 — the pre-report peak (July 1 close area), the top of the 12% run-in and now the near-term ceiling.
- $394.47 — the July 2 close; where the market repriced a record quarter.
- $375–$385 — the base the pre-report rally launched from; the natural first support and "gap-fill" zone traders are watching.
- $450 — the long-discussed breakout line from the multi-month ascending-triangle reading; the bull scenario needs a reclaim of $426 first to keep it relevant.
- $338 — the level bearish chartists have flagged as the downside objective if support at the $375–$385 base fails.
The Bullish Case
Bulls argue the market punished positioning, not the business. A 25% delivery growth rate at Tesla's scale is remarkable, the China acceleration answers a year of competitive doubts, and one down day — however ugly — doesn't break a structure that has been building higher lows for months. If the $375–$385 base holds, the sell-the-news flush actually resets sentiment for a cleaner run at $426 and eventually the $450 breakout line. In their view, margin fears are perennial and Tesla has repeatedly restored profitability through cost reduction at scale.
The Bearish Case
Bears counter that the market told you what it thinks record deliveries are worth: 7.5% less. When a stock at 421x earnings can't rally on an 18% beat, the burden of proof has flipped — the price now requires margin expansion, not just volume, and the upcoming earnings report (where per-vehicle economics are revealed) becomes a live risk event. The tax-credit expiry pulls demand forward, flattering today's numbers at tomorrow's expense. Technically, the worst day in a year from a local high is how failed runs at big levels often begin; losing $375–$385 would target the $338 area and turn the triangle narrative from breakout-in-waiting to top-in-progress.
What Traders Should Watch Next
The $375–$385 zone is the first verdict: a hold keeps the uptrend's architecture intact, a break validates the sell-the-news day as a trend signal. The Q2 earnings report is the main event — after a volume beat, the entire debate compresses into the margin line. Watch how the stock behaves on any bounce toward $426: a stall below it on light volume is the pattern bears want. And track the EV tax-credit timeline, which affects the demand math for the second half of the year.
Conclusion
Tesla's July 2 session is a reminder that markets trade expectations, not headlines. A record quarter met a stock priced for more than records, and the tape settled the argument in one candle. The result is a chart with unusually clean lines: $426 above, $375–$385 below, earnings ahead — and one of the most-watched stocks in the world sitting between them.
Sell-the-news moves are hard to trade live — practice them instead. Test this setup in BeCoin's Trading Simulator: https://becoin.net/tools/trading-simulator — replay the delivery-day candle, try both the dip-buy and the failed-bounce short, and see which discipline holds.
Risk note: This article is for information and education only and is not financial or investment advice. Individual stocks can move violently around earnings and news events; levels referenced can become outdated quickly. Always do your own research and never risk money you cannot afford to lose.
---
Gold's Multi-Year Trendline Just Broke — Why Some Traders Are Selling This Rally
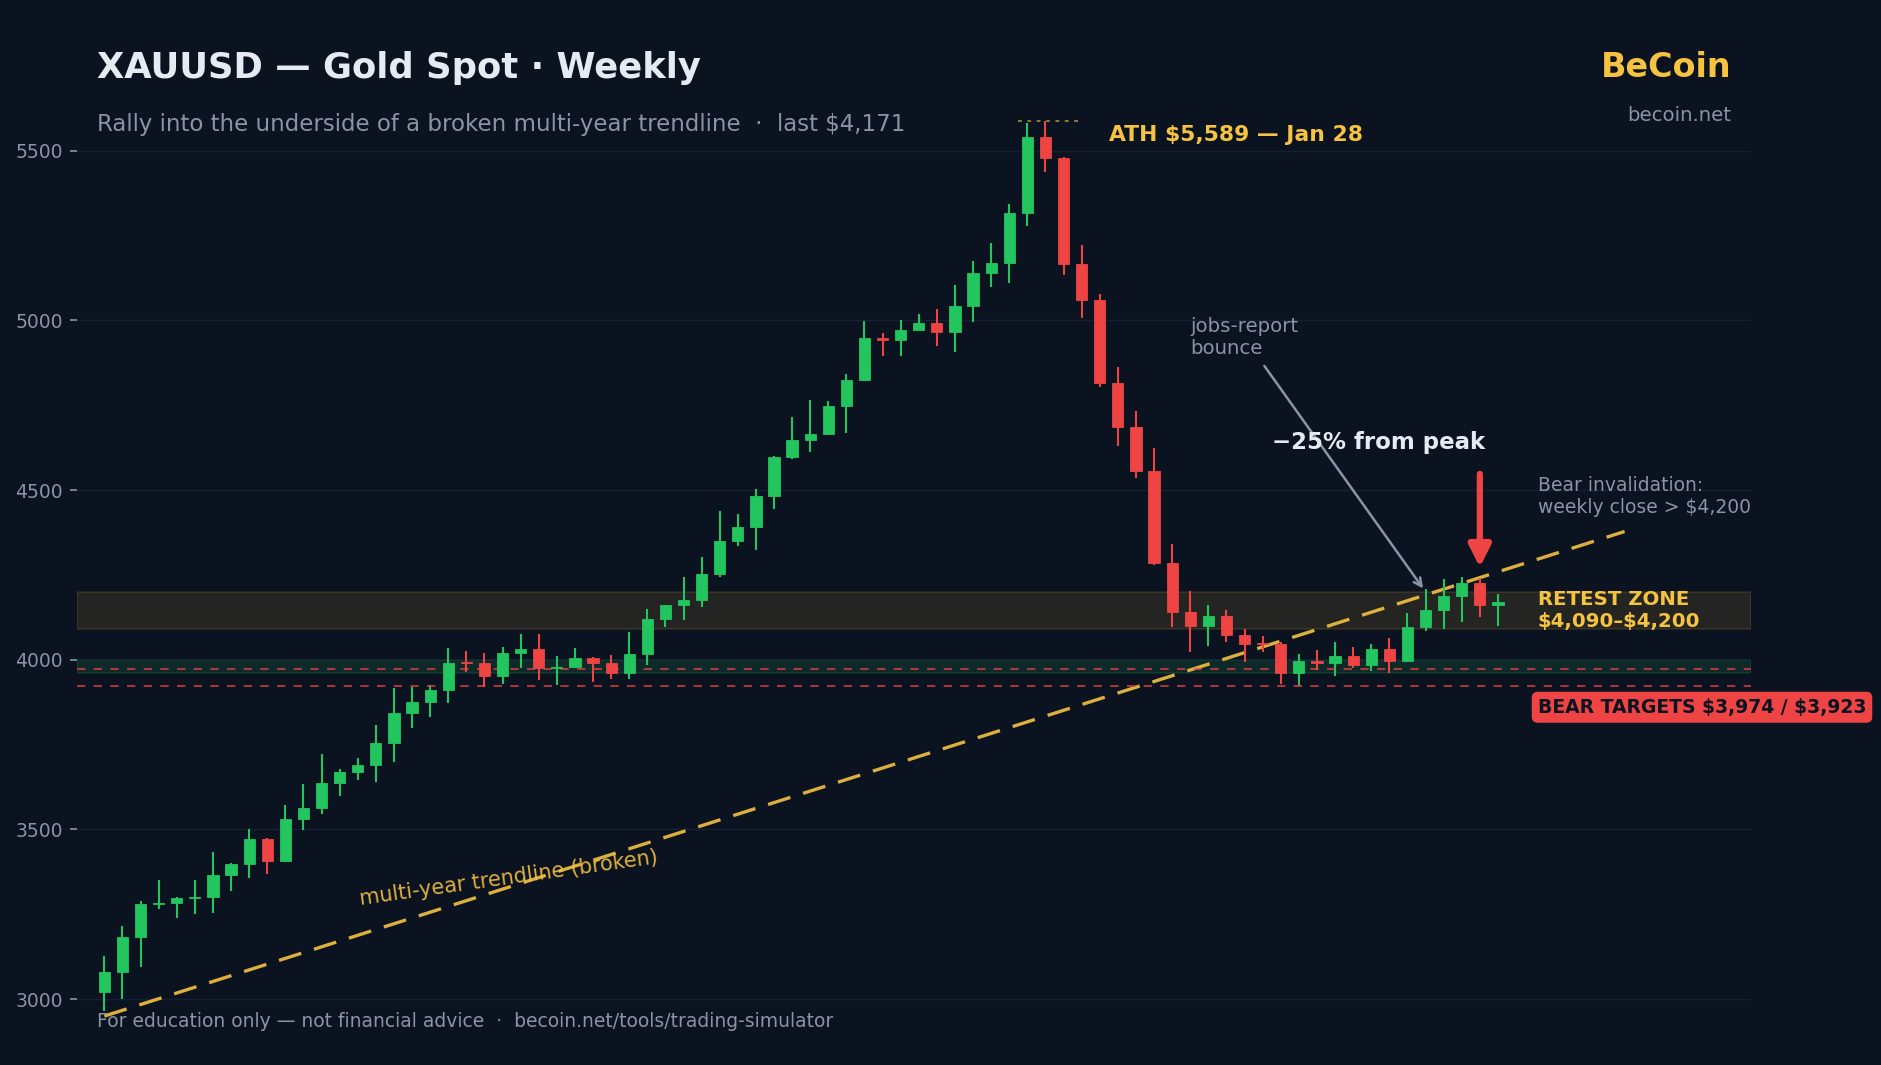
Gold rallied to $4,195, but the weekly chart shows a broken multi-year trendline and a 25% drawdown from January's $5,589 record. Here's the bear case, the key levels, and what would prove it wrong.
Gold Blasts Past $4,100 After Jobs Shock: Breakout or Trap?
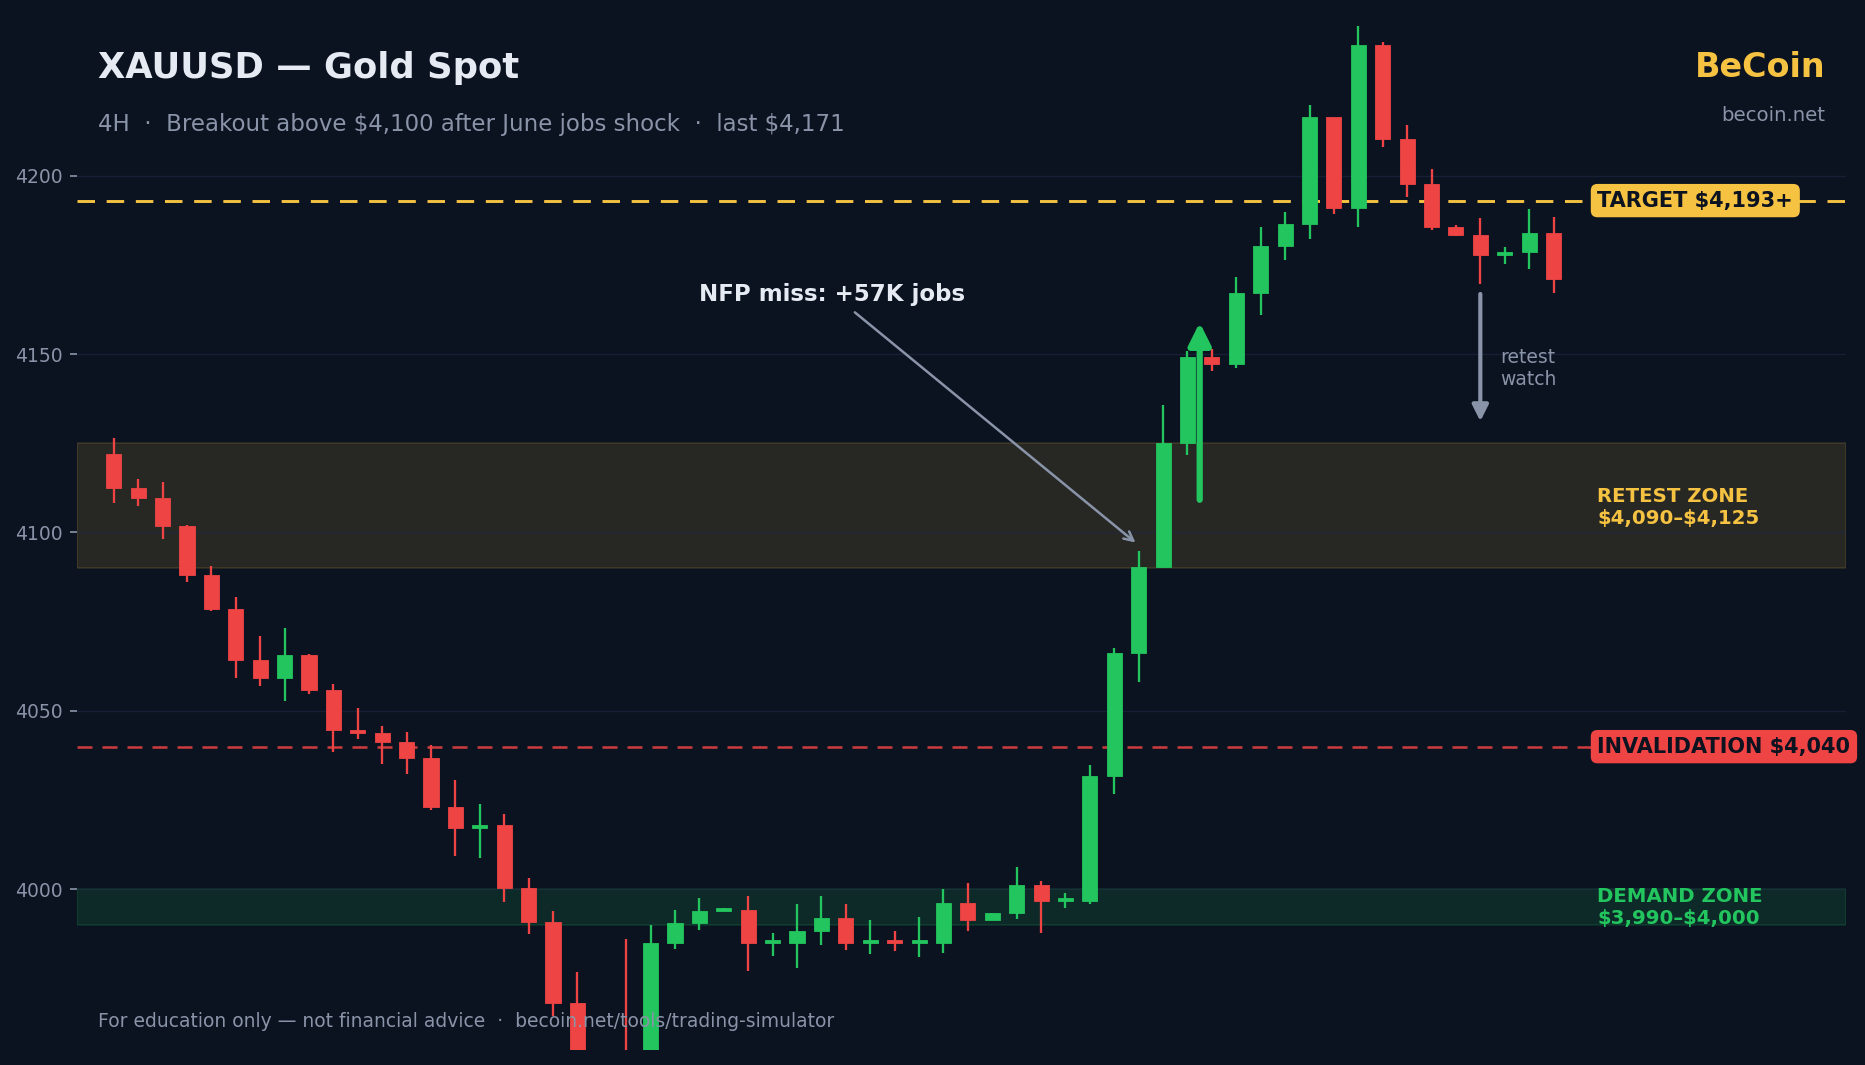
Gold surged past $4,100 after a shock US jobs miss. We map the key levels, the bullish and bearish cases, and what traders should watch next — plus how to practice the setup risk-free.
The Nasdaq's Relentless Rally Meets Its First Real Test
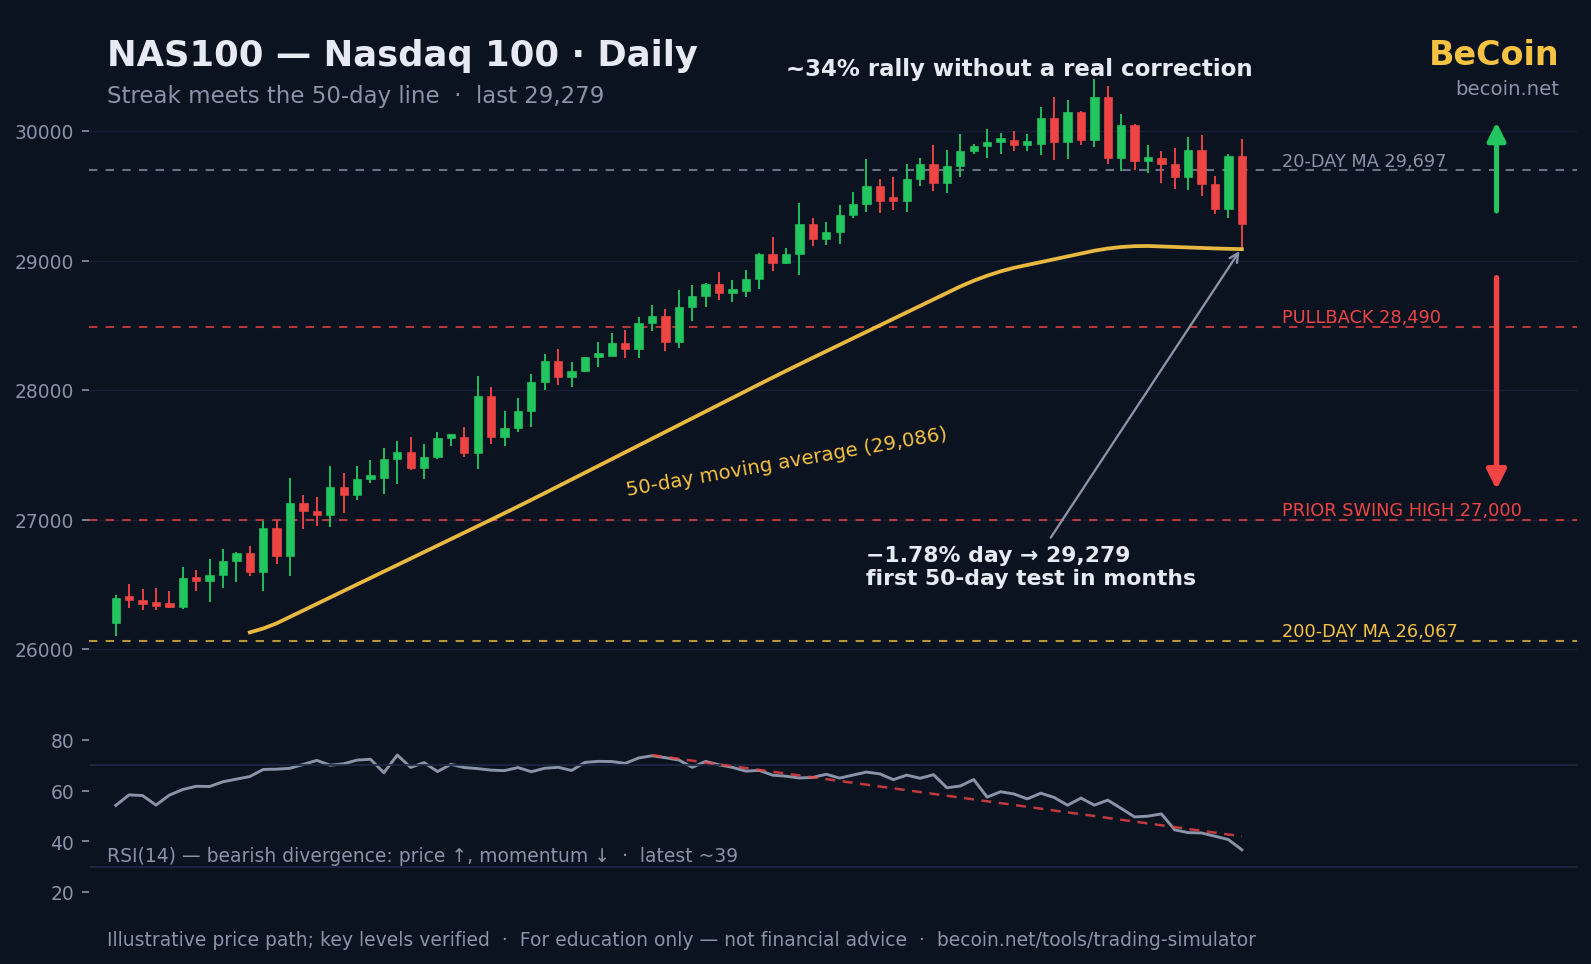
The Nasdaq 100 slipped to ~29,279, testing its 50-day average as chips sink and RSI diverges — while rate-cut hopes build. Key levels from 29,697 down to the 200-day at 26,067.
Micron's Parabolic Year: From the $1 Trillion Club to a 20% Air Pocket
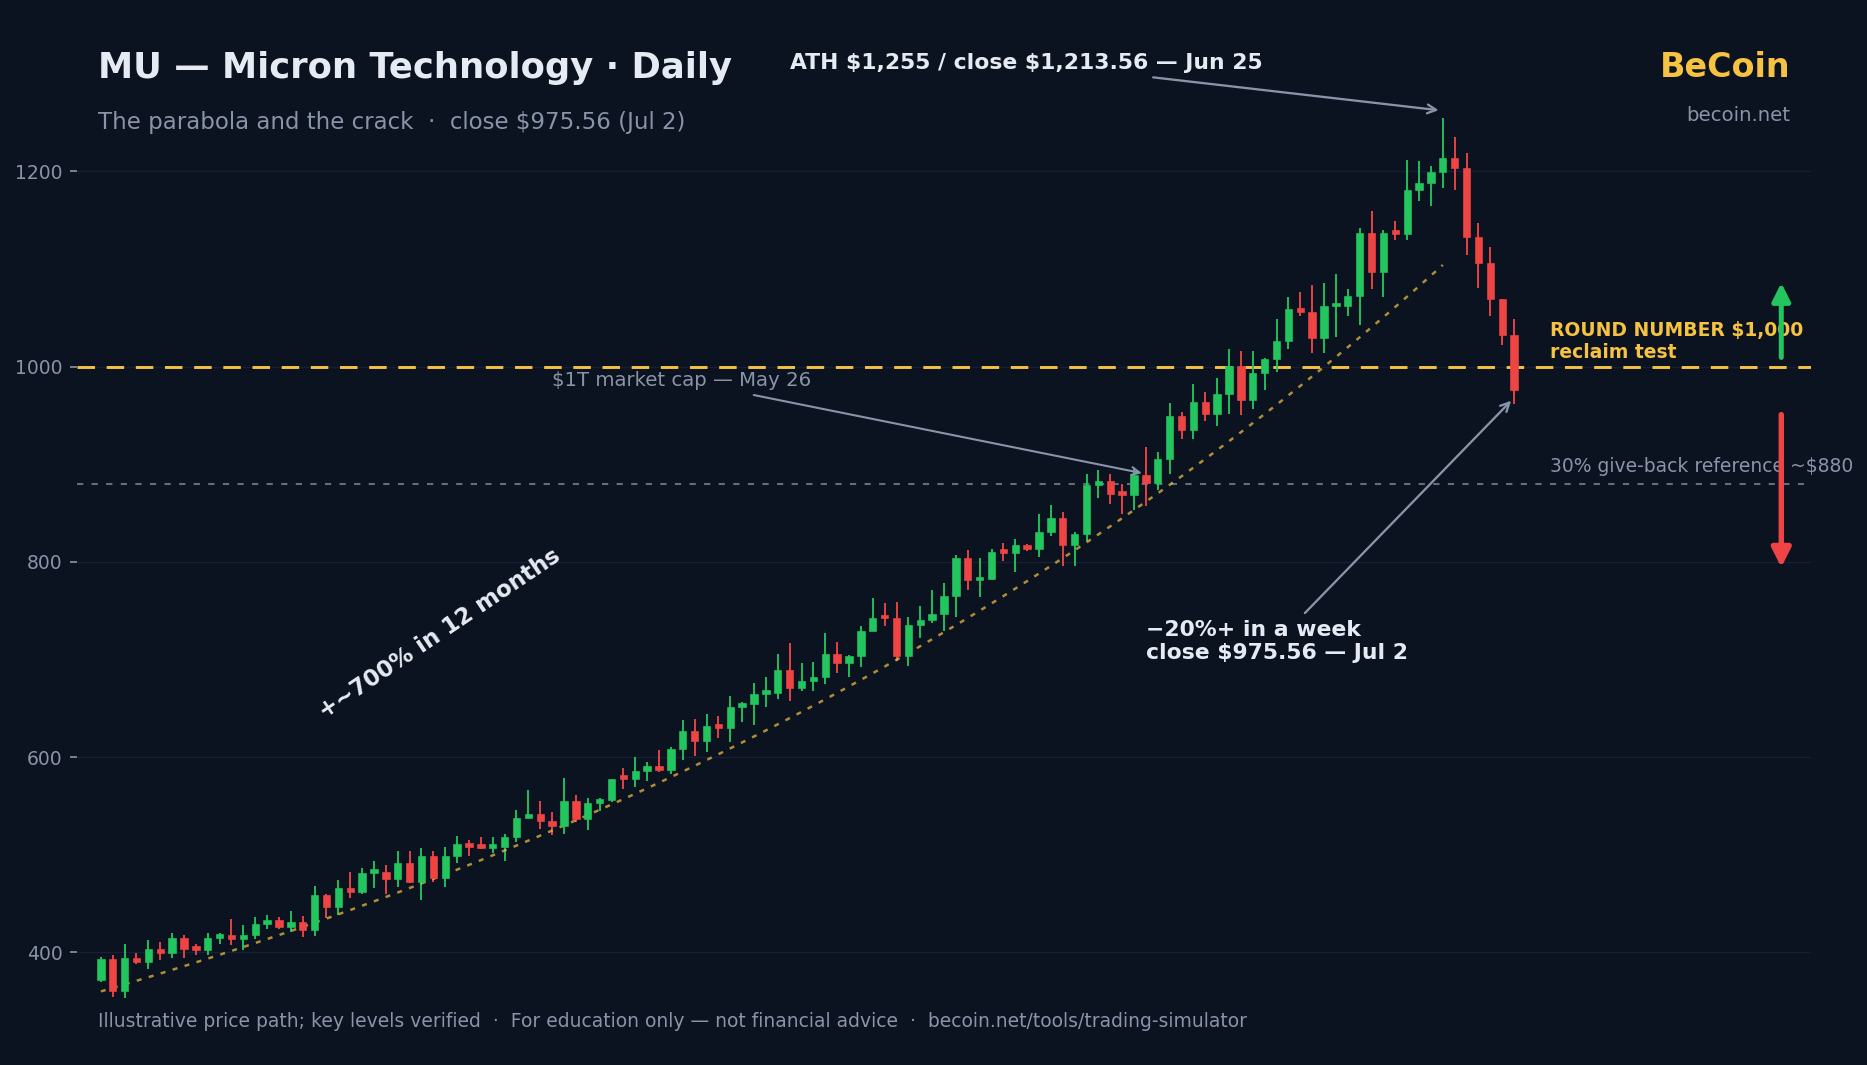
Micron rose ~700% in a year, joined the $1T club, then dropped 20% in a week to $975. We map the $1,000 battleground, the blow-off-top debate, and the levels that decide what comes next.
Yen at 40-Year Lows: Trading USDJPY Under Intervention Watch
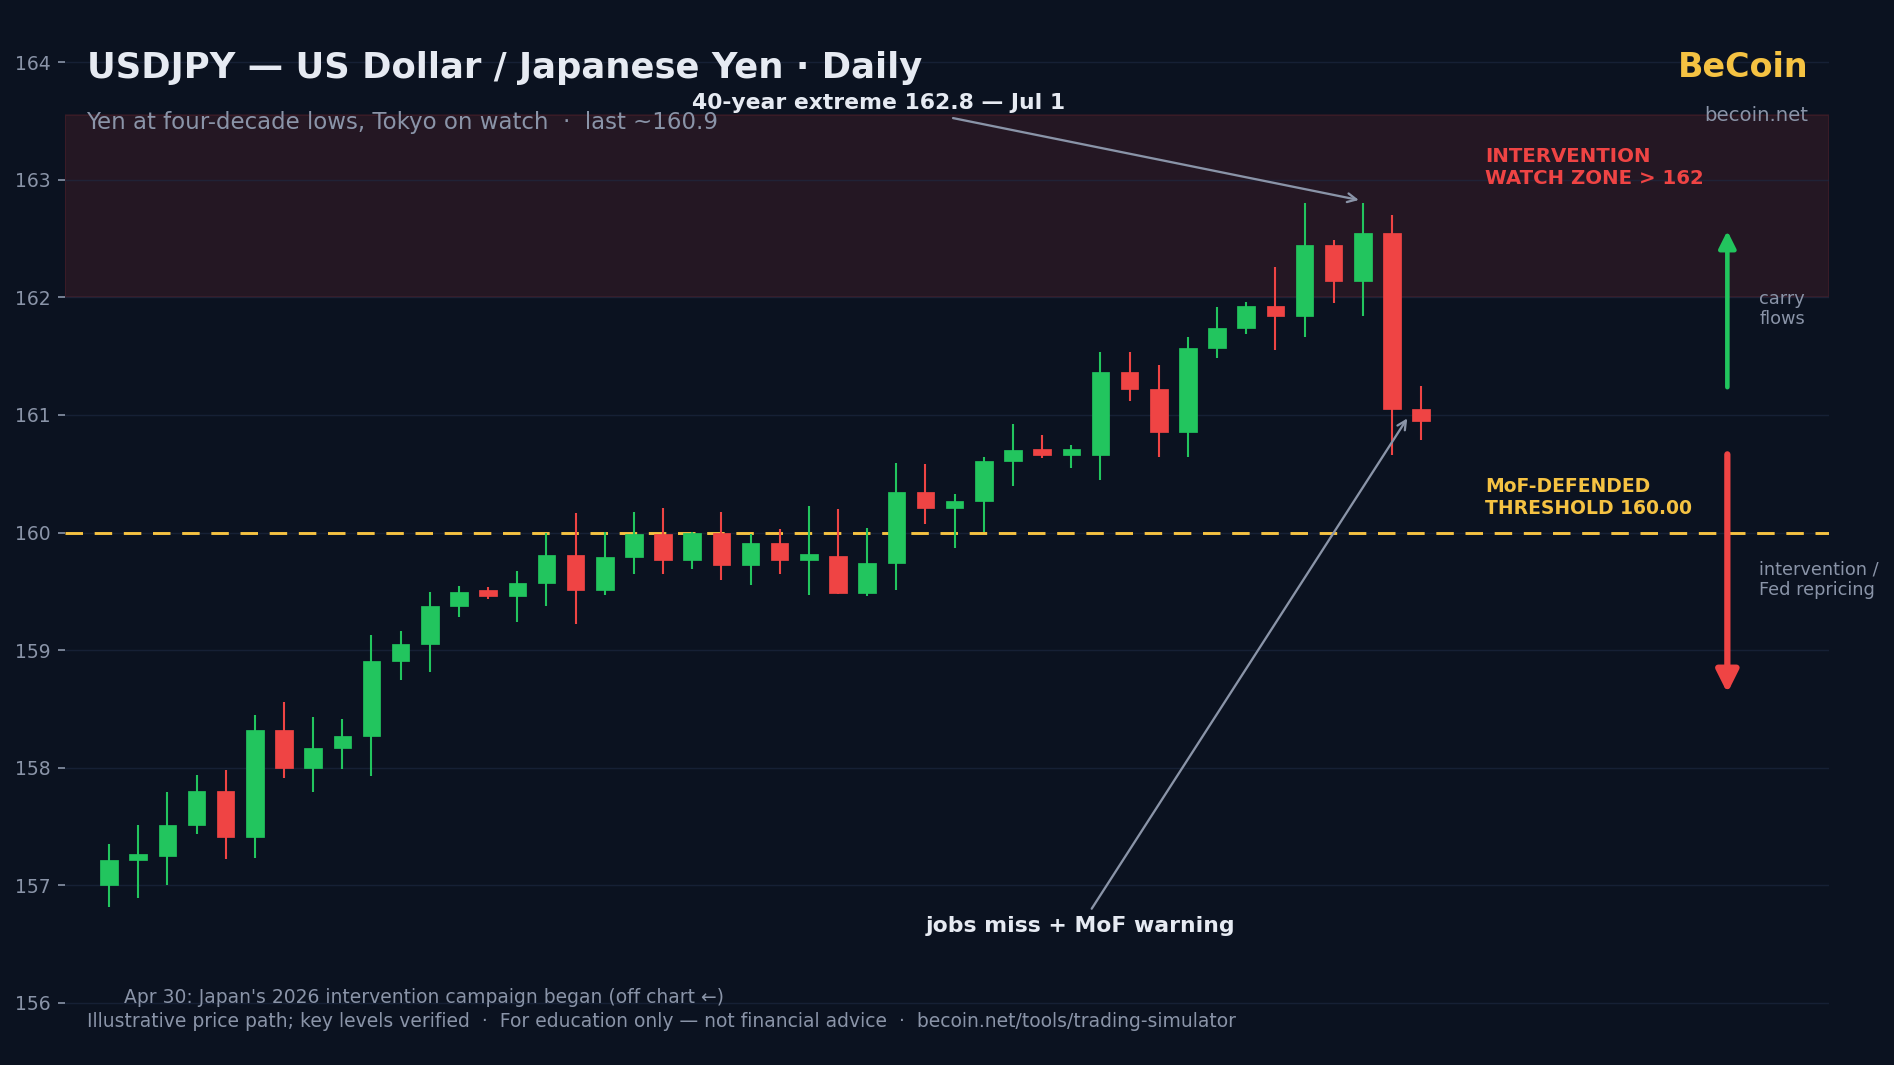
USDJPY hit 162.8 — the yen's weakest in four decades — then snapped back below 161 on weak US jobs and fresh intervention warnings from Tokyo. Key levels, both cases, and what to watch.
Solana's $80 Supply Zone: Why Traders Are Watching This Retest
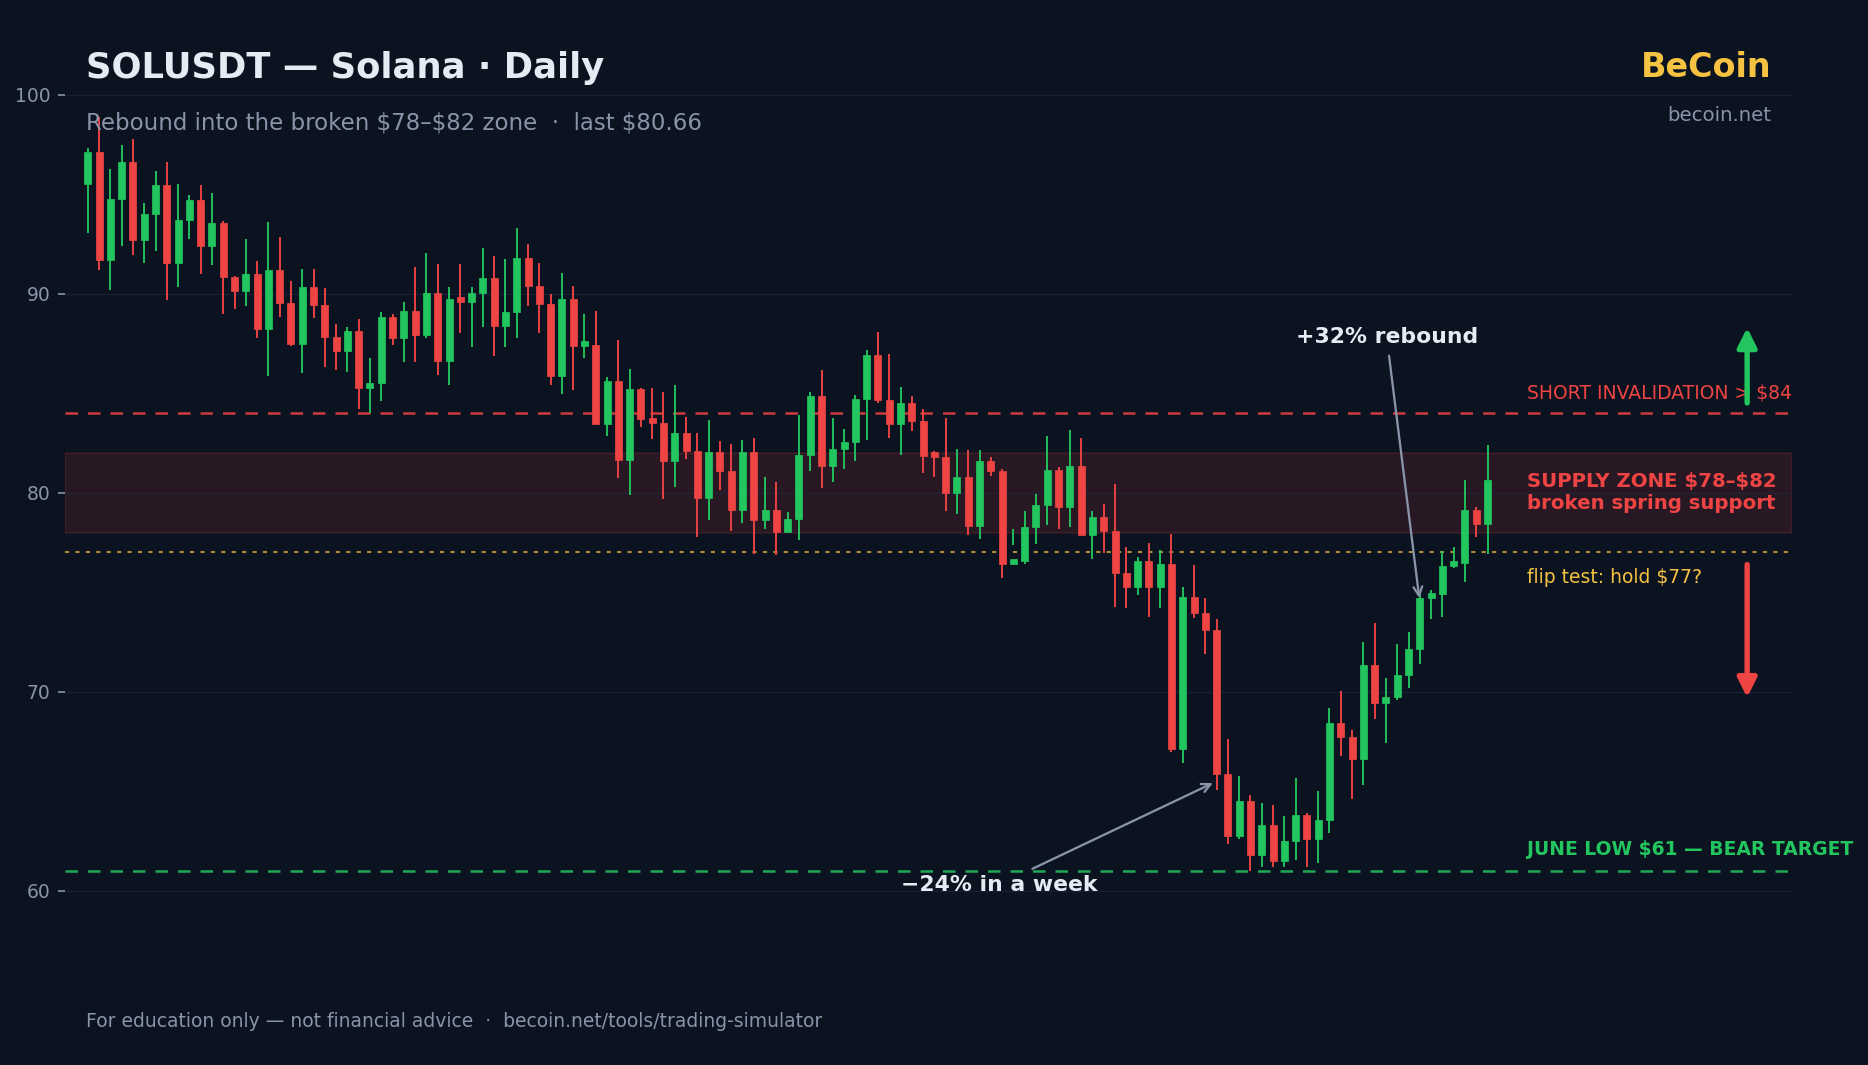
SOL rallied 32% off June's multi-year low near $61 straight into the broken $78–$82 support zone. We map the retest, the short thesis, the reclaim scenario, and the levels that decide it.