Solana's $80 Supply Zone: Why Traders Are Watching This Retest
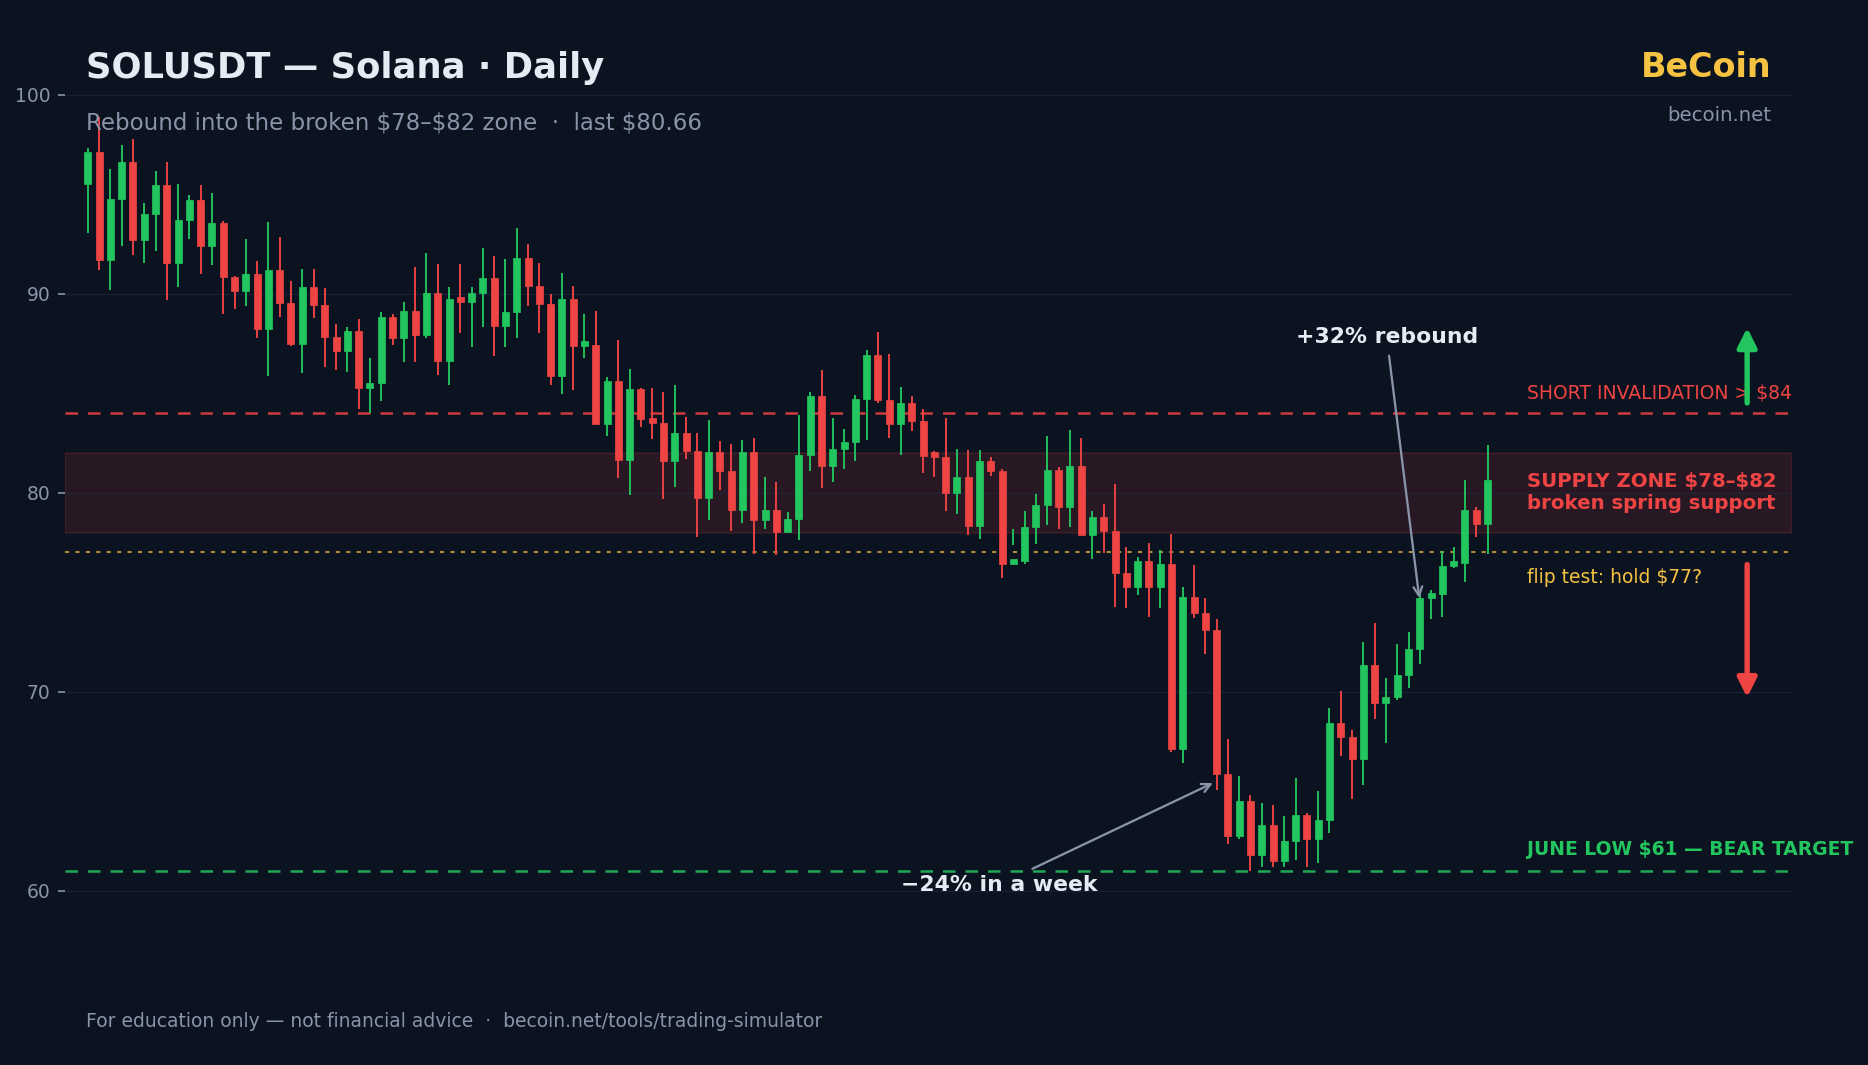
Solana just did something that gets chart watchers out of bed: it rallied 32% off a capitulation low straight back into the zone where it broke down. SOL traded at about $80.66 on July 3, swinging between $76.90 and $82.40 in a single day — squarely inside the $78–$82 band that acted as support through the spring and gave way in June's crash to multi-year lows near $61.
In technical analysis, this is the classic "retest" moment: broken support becoming resistance, or a failed breakdown becoming a launchpad. Either way, one of crypto's most-discussed charts is at its decision point right now.
The Setup
Solana's road here was brutal. After an all-time high of $295 in January 2025, SOL started 2026 around $150, got dragged to the $128 area by January's mass liquidations, and drifted to $85–$90 by April — roughly 70% below the peak. Through the spring, the $78–$82 area repeatedly caught the dips.
Then June happened. As Bitcoin slid toward $60,000 and Bitcoin ETFs saw record outflows of $6.4 billion, the altcoin market buckled and SOL crashed about 24% in a single week, bottoming near $61 — its lowest level in years. Declining institutional inflows and a roughly 30% year-over-year drop in active developers gave the bears fundamental talking points to go with the chart.
The July jobs shock changed the mood. A weaker dollar lifted crypto broadly, and SOL — the most oversold of the majors — bounced hardest, reclaiming $80 in a matter of sessions. That rally has now arrived exactly where the spring support broke.
Key Levels to Know
- $78–$82 — the battleground: former spring support, now potential resistance. Price is inside it as of this writing.
- $84 — the level short-sellers are widely using as their invalidation; sustained trade above it undermines the breakdown-retest thesis.
- $77 — the near-term flip test: bulls want to see this hold as support on dips.
- $70–$72 — the mid-point of the June collapse; first checkpoint if the zone rejects price.
- $60–$61 — the June capitulation low and the bears' target. A return there would also be a retest of the multi-year low.
The Bullish Case
Bulls read June as a liquidity flush, not a trend. The final leg down was driven by forced selling — record ETF outflows and cascading liquidations — rather than a Solana-specific failure, and such capitulation lows often mark durable bottoms. The 32% rebound came fast and hasn't meaningfully paused, which suggests real demand rather than short-covering alone. If SOL can flip $77–$80 back into support and then clear $84, the breakdown becomes a failed move — and failed moves, as the old trading adage goes, tend to lead to fast moves the other way.
The Bearish Case
Bears see a textbook short setup and are not hiding it: sell the retest of broken support at $78–$82, invalidate above $84, target the $60s. Their argument is that nothing fundamental changed in three weeks — institutional inflows were shrinking for six straight months before the crash, developer activity is down, and the bounce owes more to a single macro data point than to anything Solana did. A 32% rally into resistance after a 24% weekly crash is, in their reading, exactly how bear markets recycle optimists. Rejection here would leave a lower high in place and put $70, then $61, back on the table.
What Traders Should Watch Next
The daily closes inside versus above the $78–$82 band are the cleanest signal — acceptance above $82 (and especially $84) breaks the short thesis, while repeated rejection wicks confirm it. Watch whether $77 holds on the first real dip; that flip is the bulls' proof of concept. Broader crypto flows matter enormously here: SOL bottomed on record BTC ETF outflows, so any reversal in those flows changes the backdrop. And as with the rest of the market this summer, US macro data — jobs and inflation — keeps setting the tide that decides whether altcoin rallies get extended or sold.
Conclusion
Solana's chart currently offers one of the sharpest defined setups in crypto: a violent breakdown, a violent recovery, and both landing on the same $4 band of price. Bulls need acceptance; bears need rejection; both will know quickly. That clarity — rare in markets — is exactly why this retest has become appointment viewing.
Watch it with skin in the game but nothing at stake. Test this setup in BeCoin's Trading Simulator: https://becoin.net/tools/trading-simulator — set the short at the zone with a stop above $84, set the long on a reclaim, and let the tape pick the winner.
Related: Bitcoin's $6,000 box and Ethereum's yearly lows.
Risk note: This article is for information and education only and is not financial or investment advice. Cryptocurrencies — and Solana in particular this year — are extremely volatile; retests can resolve violently in either direction, and the levels discussed can become outdated within hours. Always do your own research and never risk money you cannot afford to lose.
---
Bitcoin's $6,000 Box: The Levels Both Bulls and Bears Are Watching
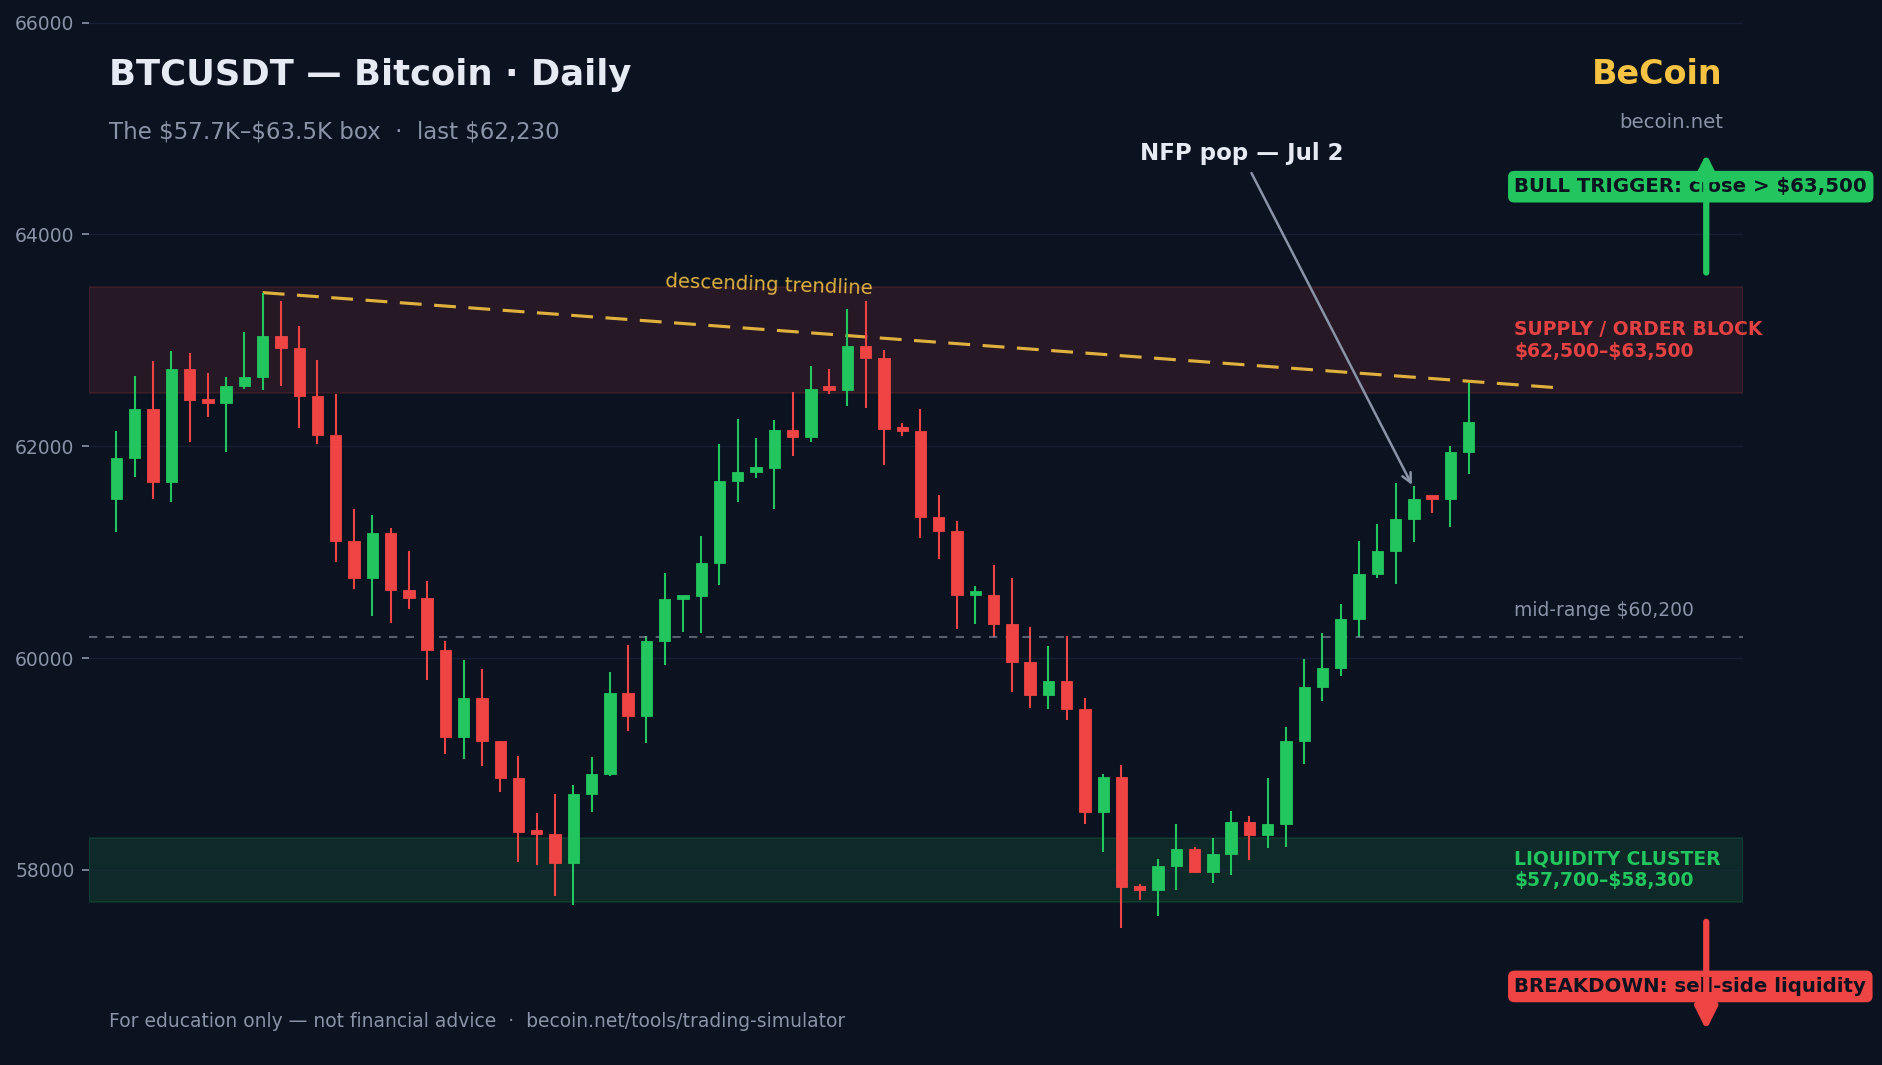
Bitcoin is trading near $62K inside a $6,000 range both sides are watching. We break down the supply zone, the liquidity cluster below, both scenarios, and what confirms a real breakout.
Gold's Multi-Year Trendline Just Broke — Why Some Traders Are Selling This Rally
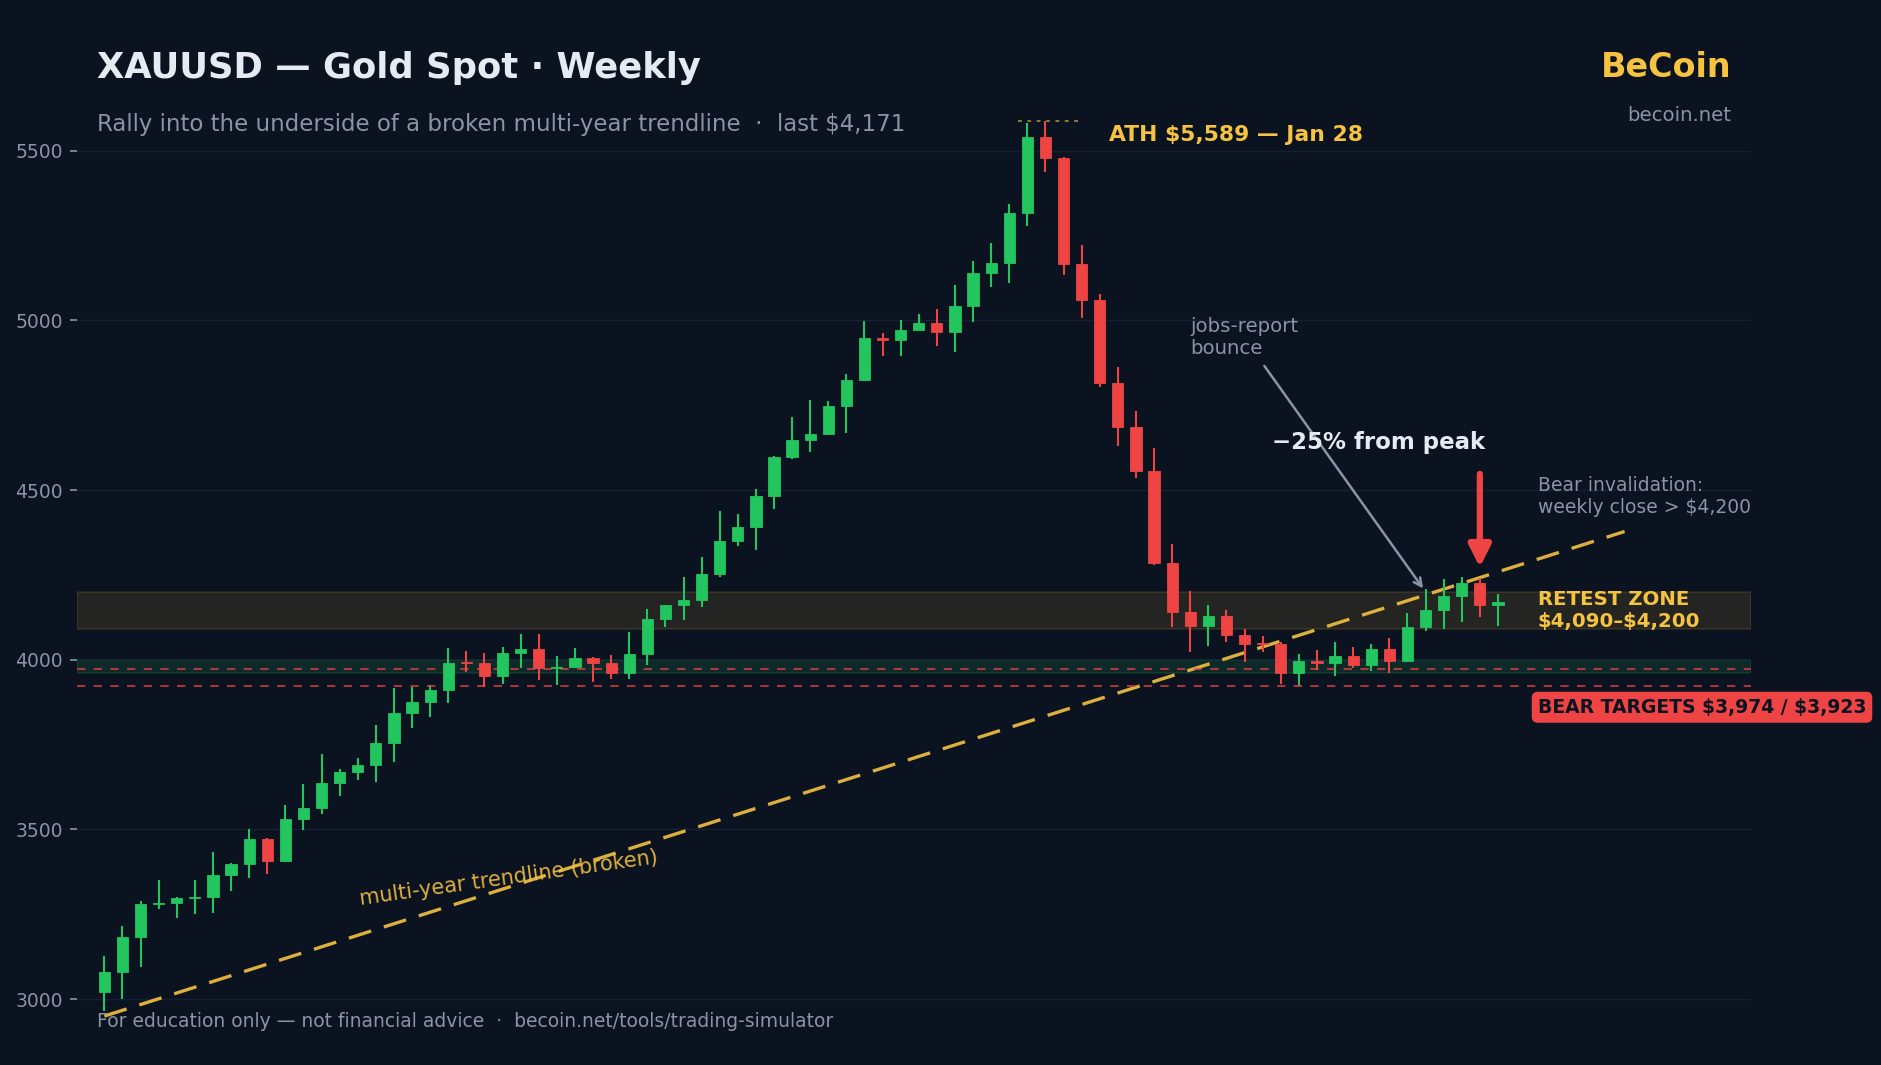
Gold rallied to $4,195, but the weekly chart shows a broken multi-year trendline and a 25% drawdown from January's $5,589 record. Here's the bear case, the key levels, and what would prove it wrong.
Micron's Parabolic Year: From the $1 Trillion Club to a 20% Air Pocket
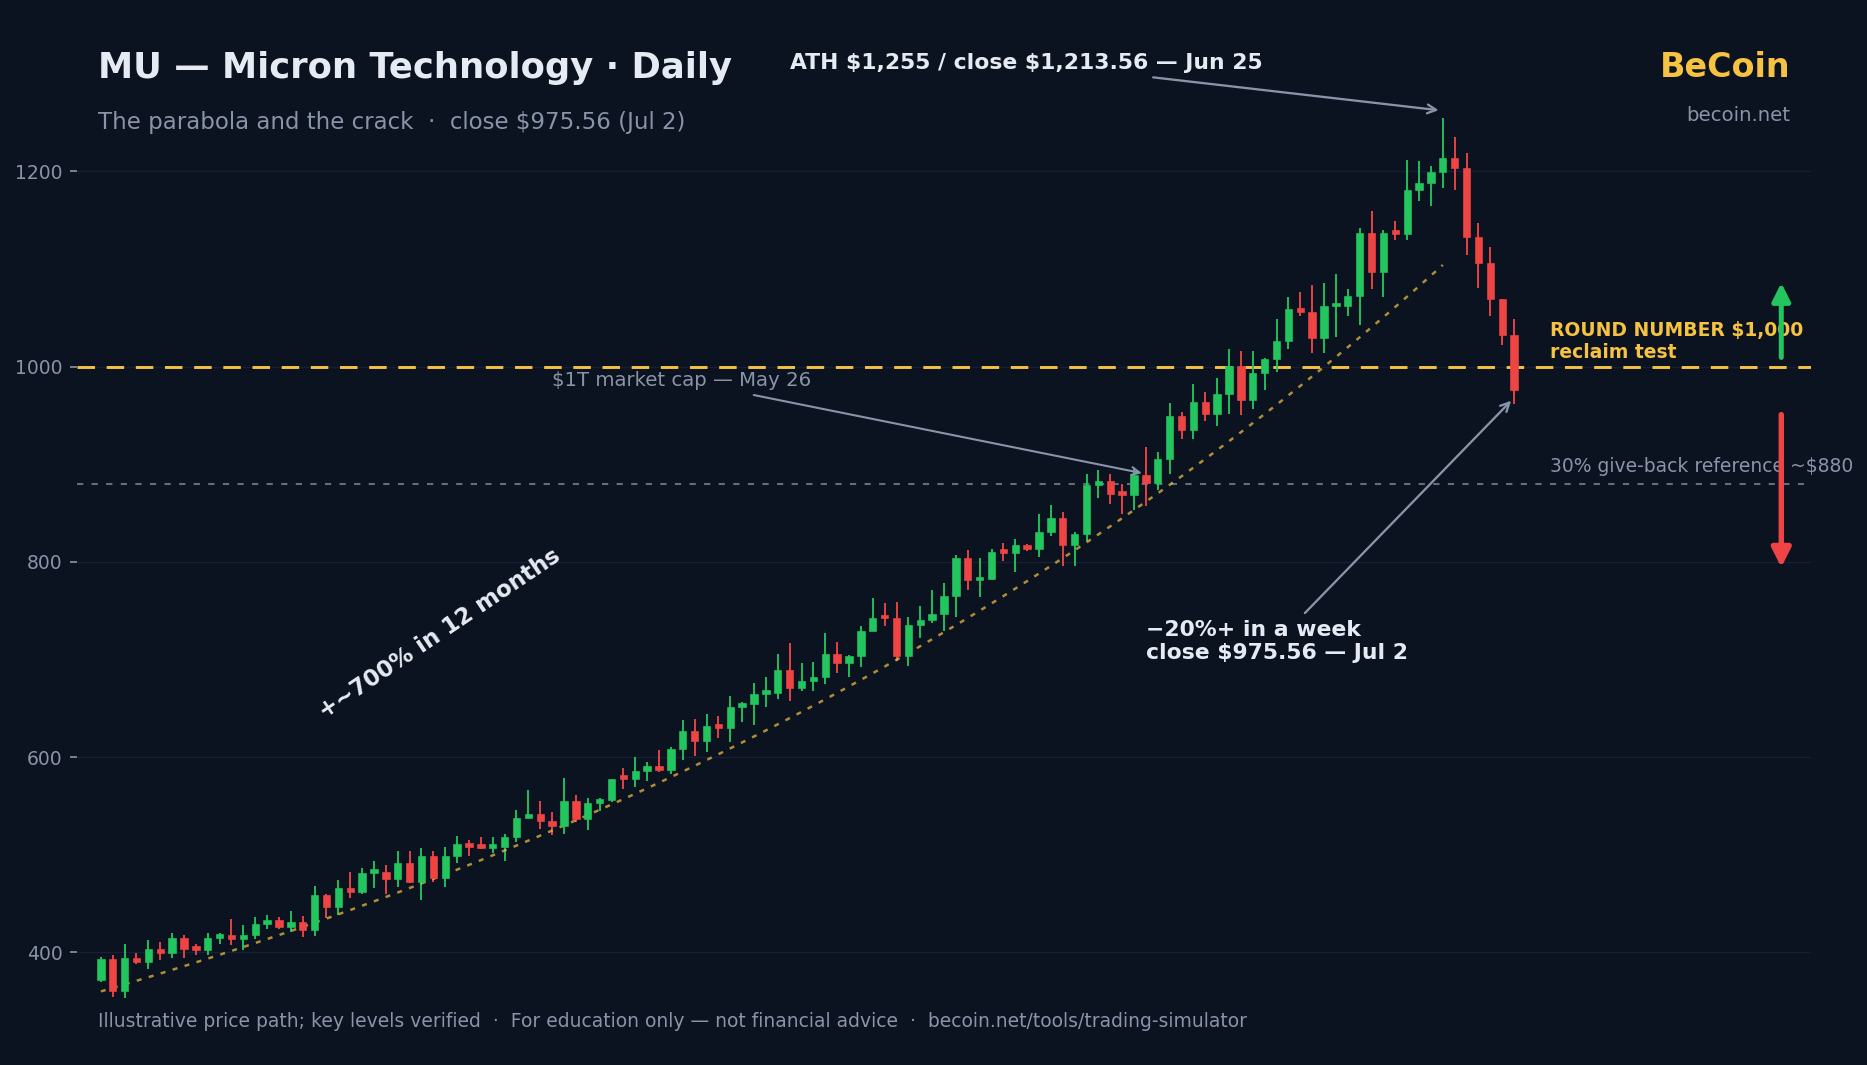
Micron rose ~700% in a year, joined the $1T club, then dropped 20% in a week to $975. We map the $1,000 battleground, the blow-off-top debate, and the levels that decide what comes next.
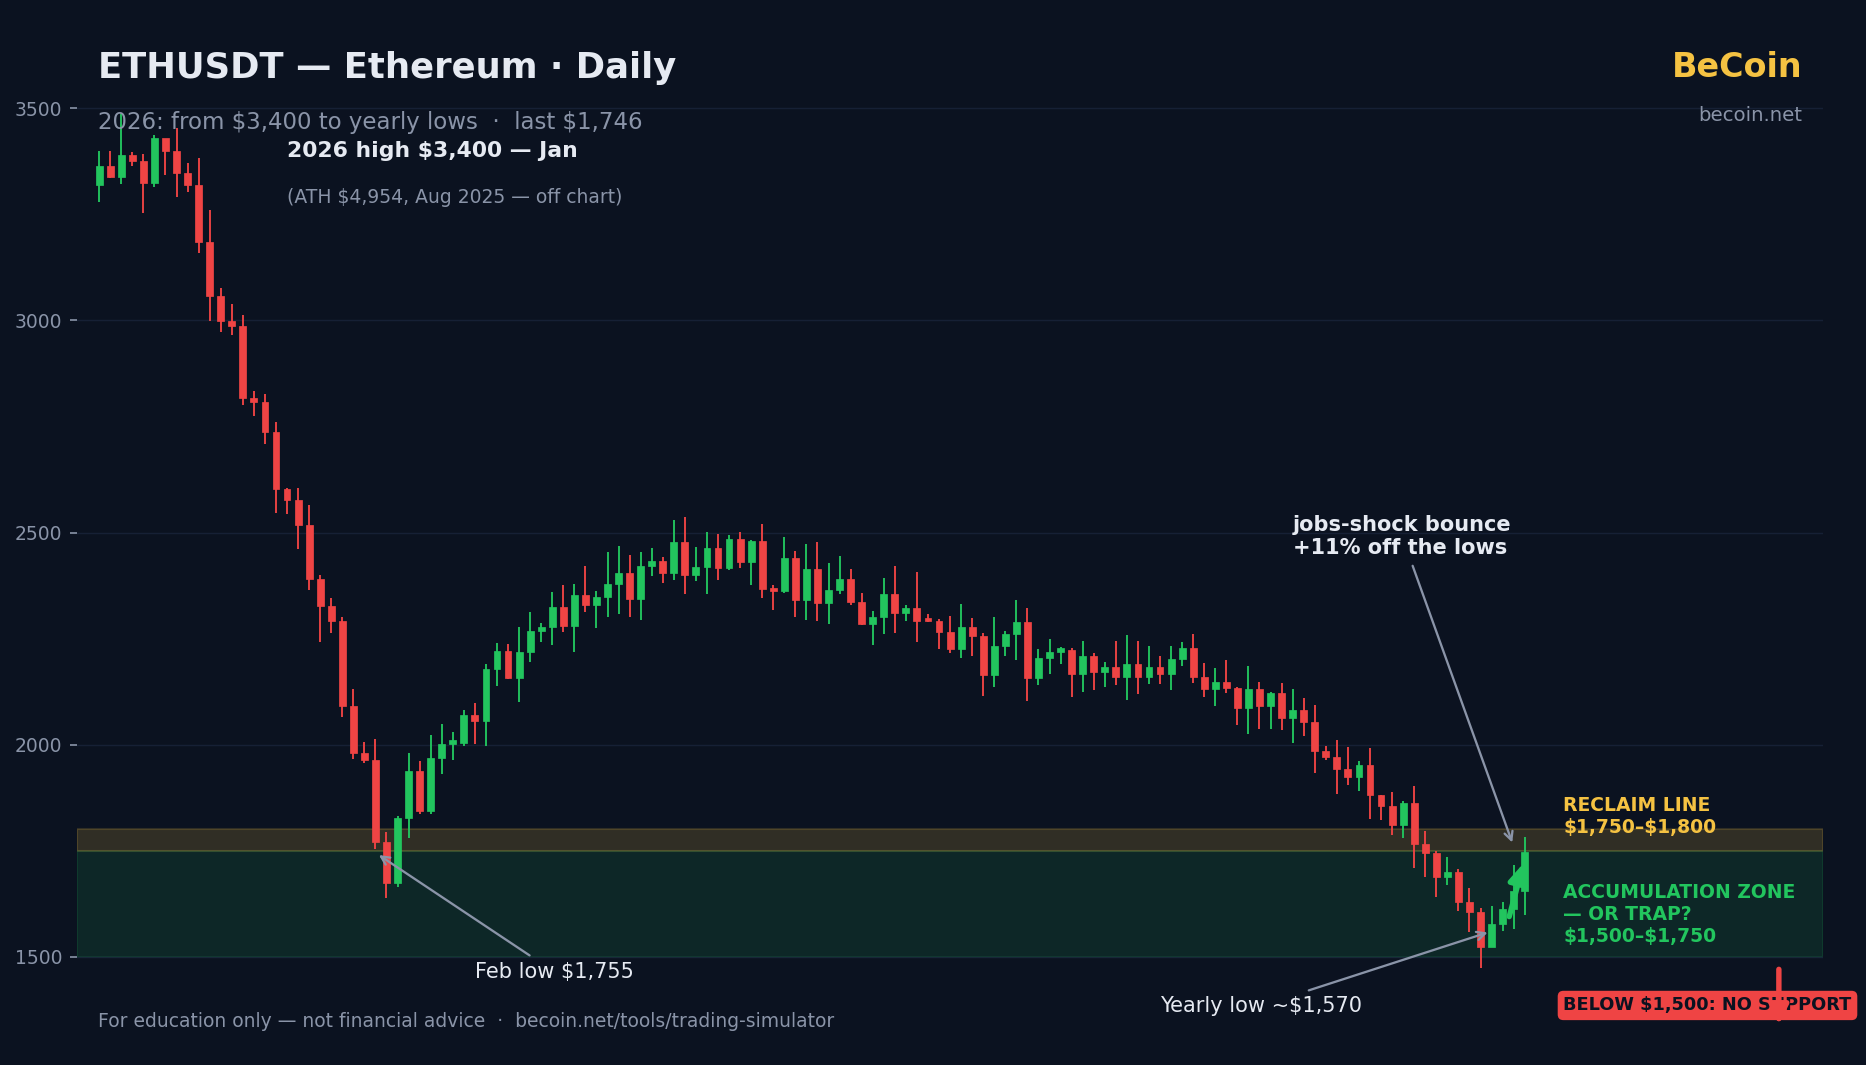
Ethereum at Yearly Lows: Accumulation Zone or Value Trap?
ETH bounced off yearly lows near $1,570 to $1,746 after the US jobs shock, still ~65% below its all-time high. We weigh the accumulation case against the value-trap case, level by level.
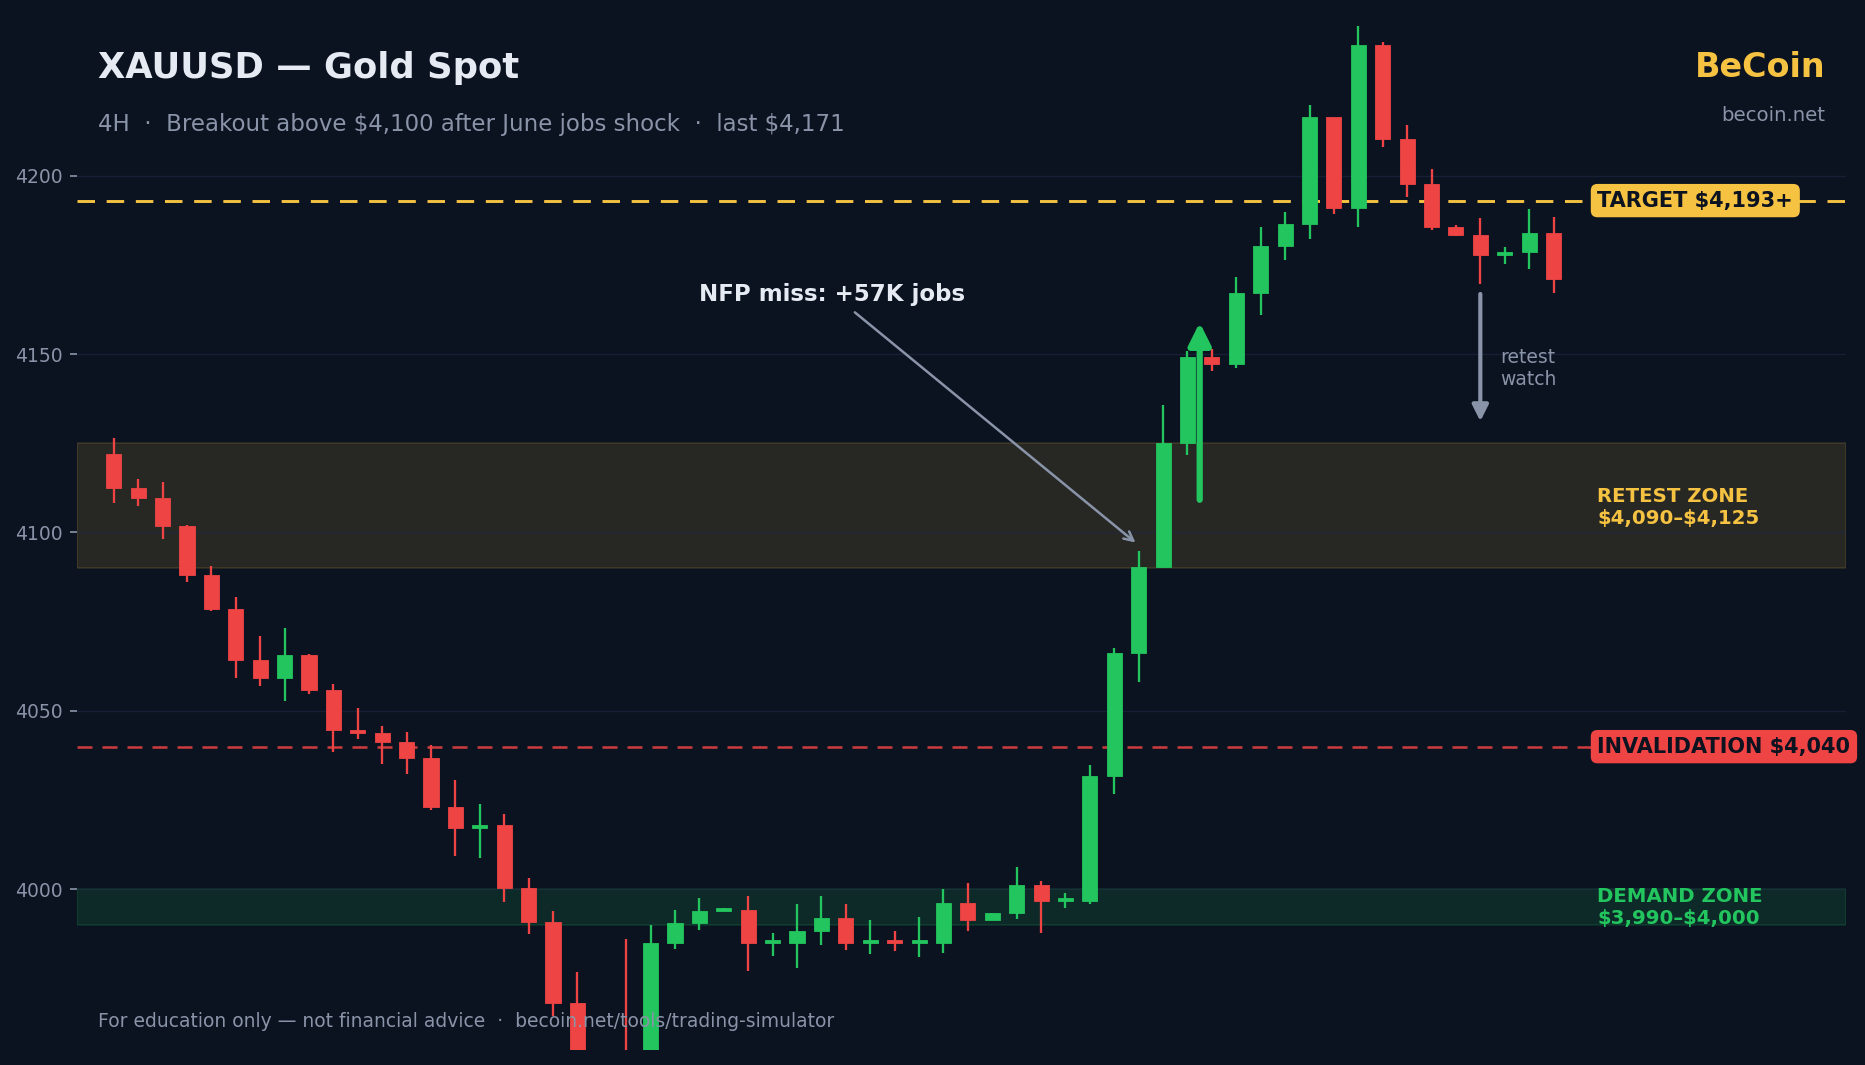
Gold Blasts Past $4,100 After Jobs Shock: Breakout or Trap?
Gold surged past $4,100 after a shock US jobs miss. We map the key levels, the bullish and bearish cases, and what traders should watch next — plus how to practice the setup risk-free.
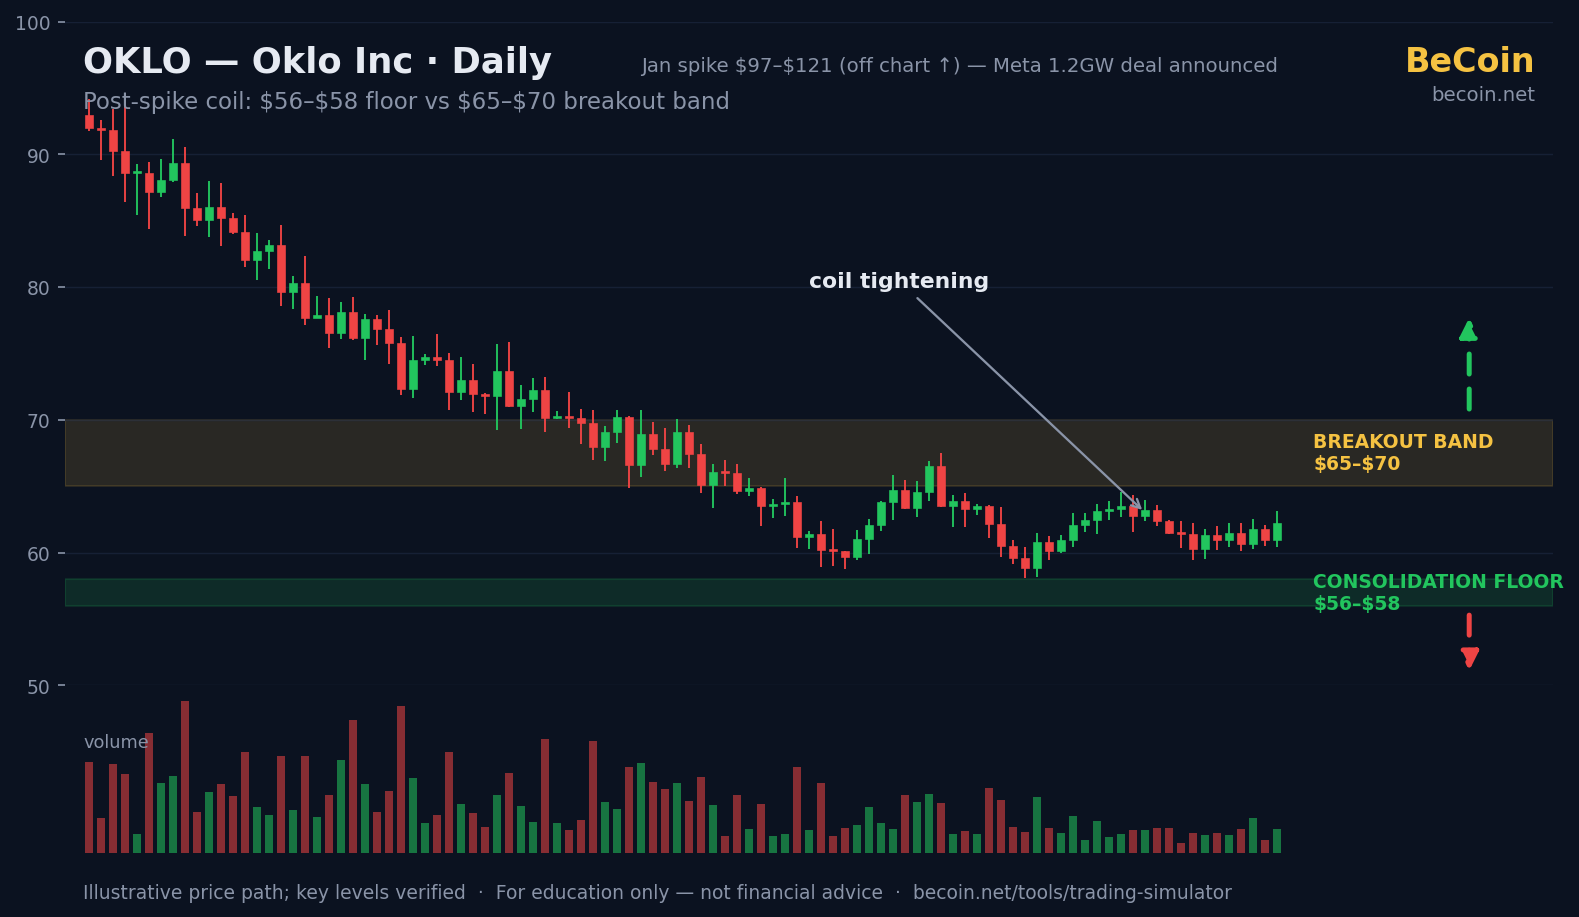
Oklo and the AI Power Trade: A Coiled Chart Meets a Hot Narrative
Oklo's Meta-backed 1.2GW nuclear deal validated the story, but the stock halved from January's spike into a tight $56–$70 range. We map the coil, both cases, and the breakout triggers.