Gold's Multi-Year Trendline Just Broke — Why Some Traders Are Selling This Rally
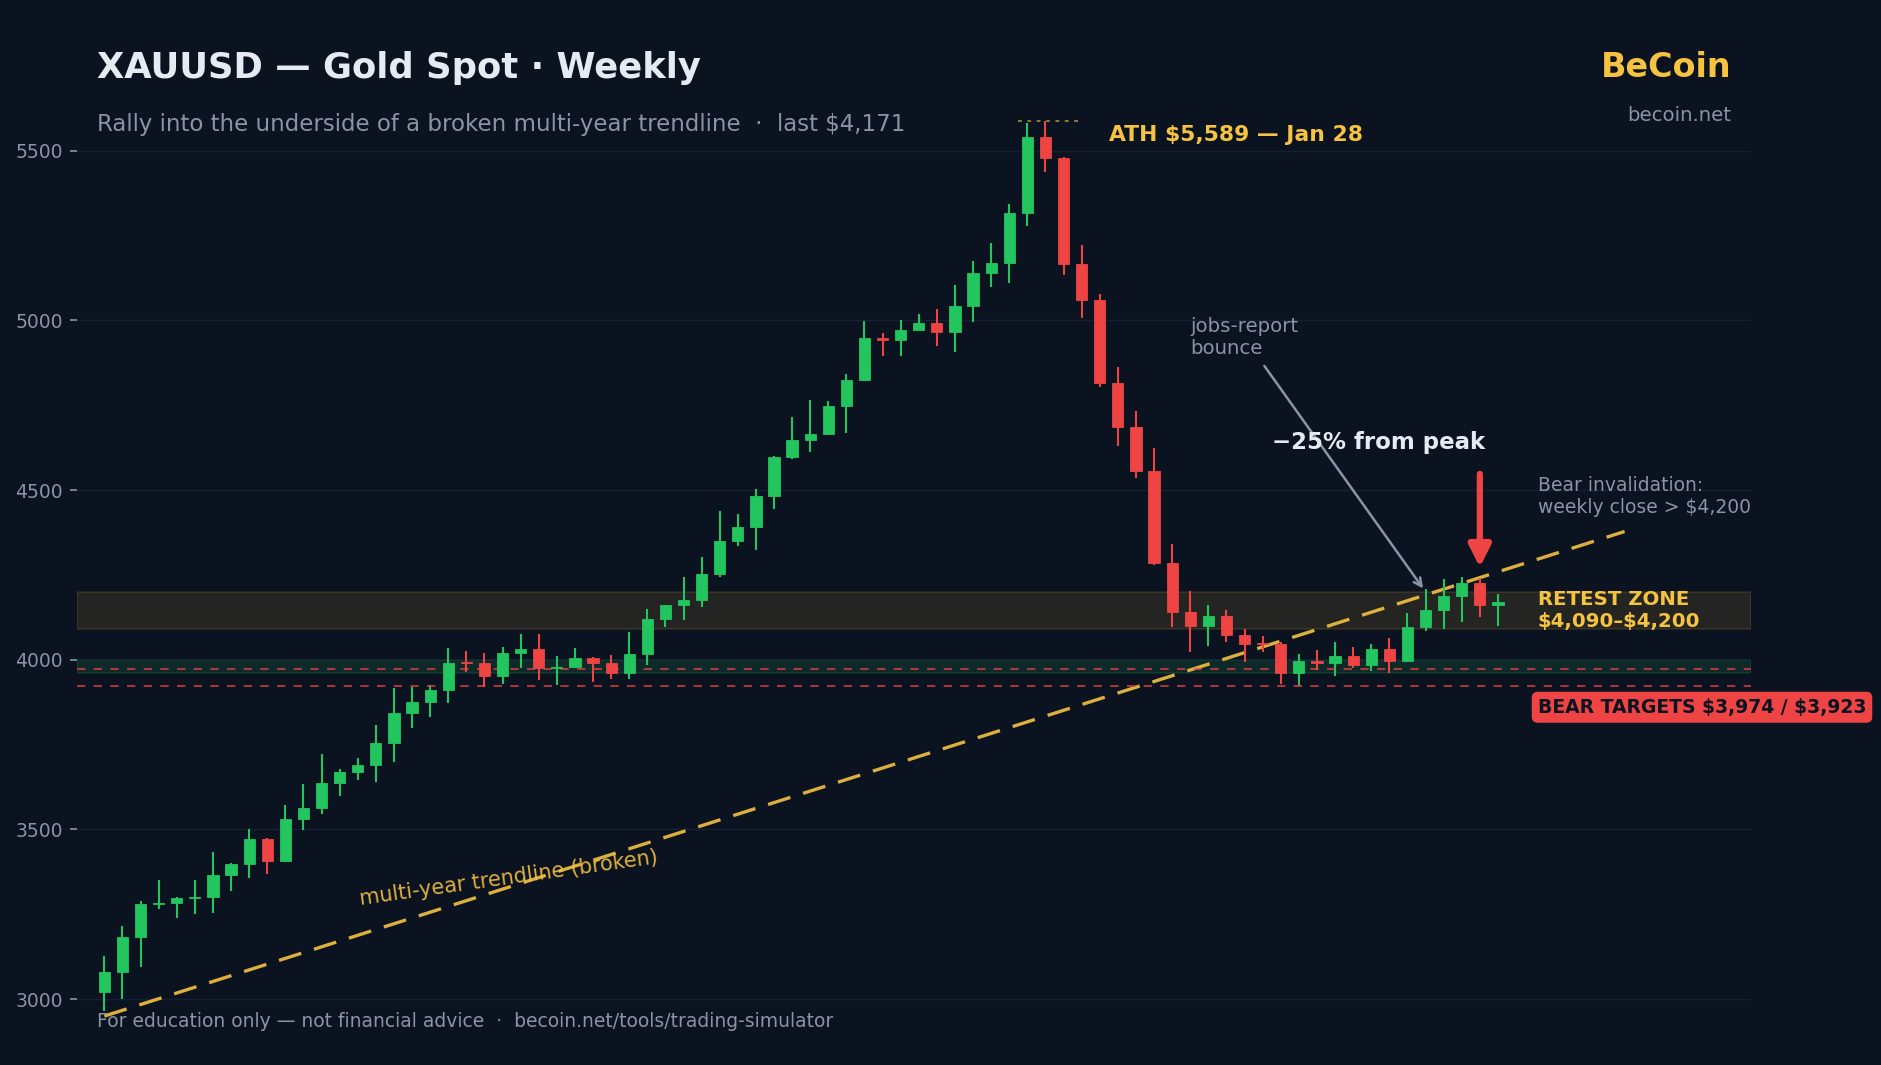
Gold bulls are celebrating a triumphant week: a weak US jobs report sent the metal surging past $4,100 to nearly $4,195, its best level in weeks. But zoom out to the weekly chart and the picture looks very different. Gold is still trading roughly 25% below its all-time high of about $5,589, set on January 28, 2026 — and somewhere on the way down, it broke the multi-year uptrend line that had defined the entire bull run.
That single structural fact is why a vocal camp of traders is treating this week's rally not as a comeback, but as a selling opportunity. Here is the bear case, laid out level by level — and what would prove it wrong.
The Setup
From the January peak near $5,589, gold corrected sharply as US–Iran tensions eased and equity markets recovered, draining the safe-haven premium that had powered the final leg of the rally. By June, the decline had done real technical damage: the long-term ascending trendline connecting the bull market's major weekly lows gave way, and price spent weeks consolidating in the $3,960–$4,090 band, repeatedly leaning on the psychologically loaded $4,000 round number.
In classical technical analysis, a broken multi-year trendline flips the script. Rallies back toward the broken line are no longer dips to buy by default — they become potential retests, places where former support turns into resistance. This week's jobs-driven spike carried gold straight back into that territory.
Key Levels to Know
- ~$5,589 — the January all-time high, now the reference point for the entire correction.
- $4,190–$4,200 — this week's high and the first serious test for bears. Sustained acceptance above it starts to unravel the bear case.
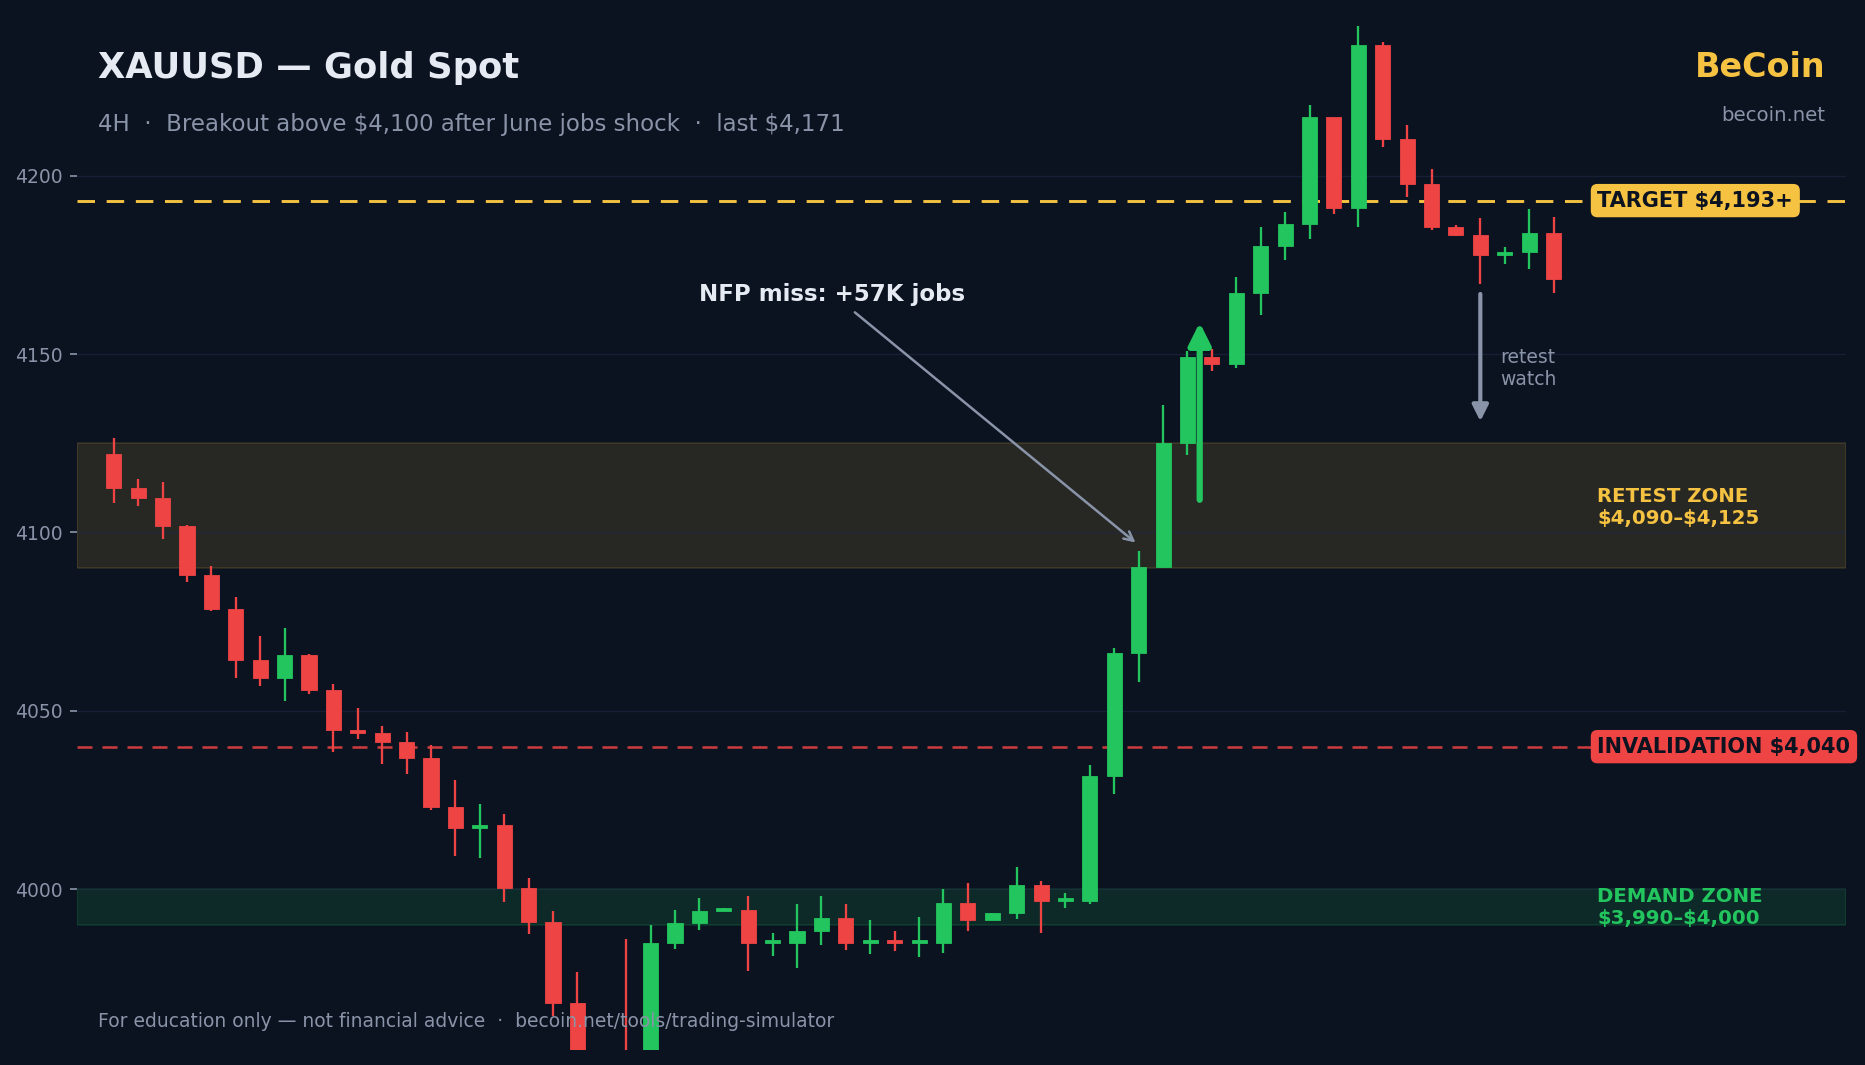
- $4,090–$4,125 — the former resistance band gold just spiked through. Bears want to see price fall back below it; some pattern traders have mapped reversal structures completing in the $4,091–$4,122 area.
- $4,040 — the pre-breakout pivot. A drop back below would mark a failed breakout.
- $4,011 → $3,974 → $3,923 — the staircase of downside objectives circulating among bearish chartists if the rejection plays out.
- $3,960–$4,000 — the demand zone that has absorbed every sell-off since the correction began. The bear thesis ultimately needs this floor to break.
The Bearish Case
The core argument is structure over headlines. One soft jobs print does not repair a broken multi-year trendline or reclaim a 25% drawdown. Bears note that the rally was driven by a single data release, unfolded thinly ahead of a US holiday weekend, and stalled almost exactly where reversal patterns and the underside of the old trendline converge. In their playbook, this is what a bear-market rally looks like: fast, emotional, and terminal at resistance. If sellers reject the $4,190–$4,200 area, the route back through $4,125, $4,040 and toward the $3,974–$3,923 objectives is well signposted.
The Bullish Case
Bulls counter that corrections of 20–30% inside secular bull markets are historically common, and that the macro backdrop just shifted in gold's favor: a cooling labor market, softening rate expectations under Fed Chair Kevin Warsh, and the first genuine cracks in the dollar's uptrend. They also point out that the $3,990–$4,000 demand zone has now survived multiple tests — the kind of repeated defense that often marks a correction low. If gold holds above the reclaimed $4,090–$4,125 band and prints a weekly close above $4,200, the trendline break starts to look like a bear trap rather than a regime change.
What Traders Should Watch Next
The weekly close is the bears' scoreboard: a rejection candle from this zone keeps their thesis alive, while a strong close above $4,200 badly damages it. Next, watch how price behaves on the first dip — if $4,090–$4,125 holds as support, the bearish retest reading weakens with every bounce. On the macro side, the next US inflation and employment data will decide whether the jobs miss was a trend or a blip, and any pushback from the Fed against rate-cut pricing would hand momentum straight back to the dollar — and to gold bears. Finally, keep the January high in perspective: until gold is much closer to $5,589 than to $4,000, both camps are still arguing inside a correction.
Conclusion
The same candles can tell two stories. On the daily chart, gold just staged an impressive breakout; on the weekly, it rallied into the underside of a broken multi-year trendline while nursing a 25% drawdown. That tension — breakout below, retest above — is precisely what makes the current zone so important, and why disciplined traders on both sides have rarely had clearer lines in the sand.
Want to argue the bear side without betting real money on it? Test this setup in BeCoin's Trading Simulator: https://becoin.net/tools/trading-simulator — short the retest, set your invalidation above $4,200, and see whether the trendline break holds.
Related: Gold's $4,100 breakout-or-trap setup.
Risk note: This article is for information and education only and is not financial or investment advice. Gold is volatile, the levels discussed here can change rapidly, and broken trendlines do not guarantee further declines. Always do your own research and never risk money you cannot afford to lose.
---
Solana's $80 Supply Zone: Why Traders Are Watching This Retest
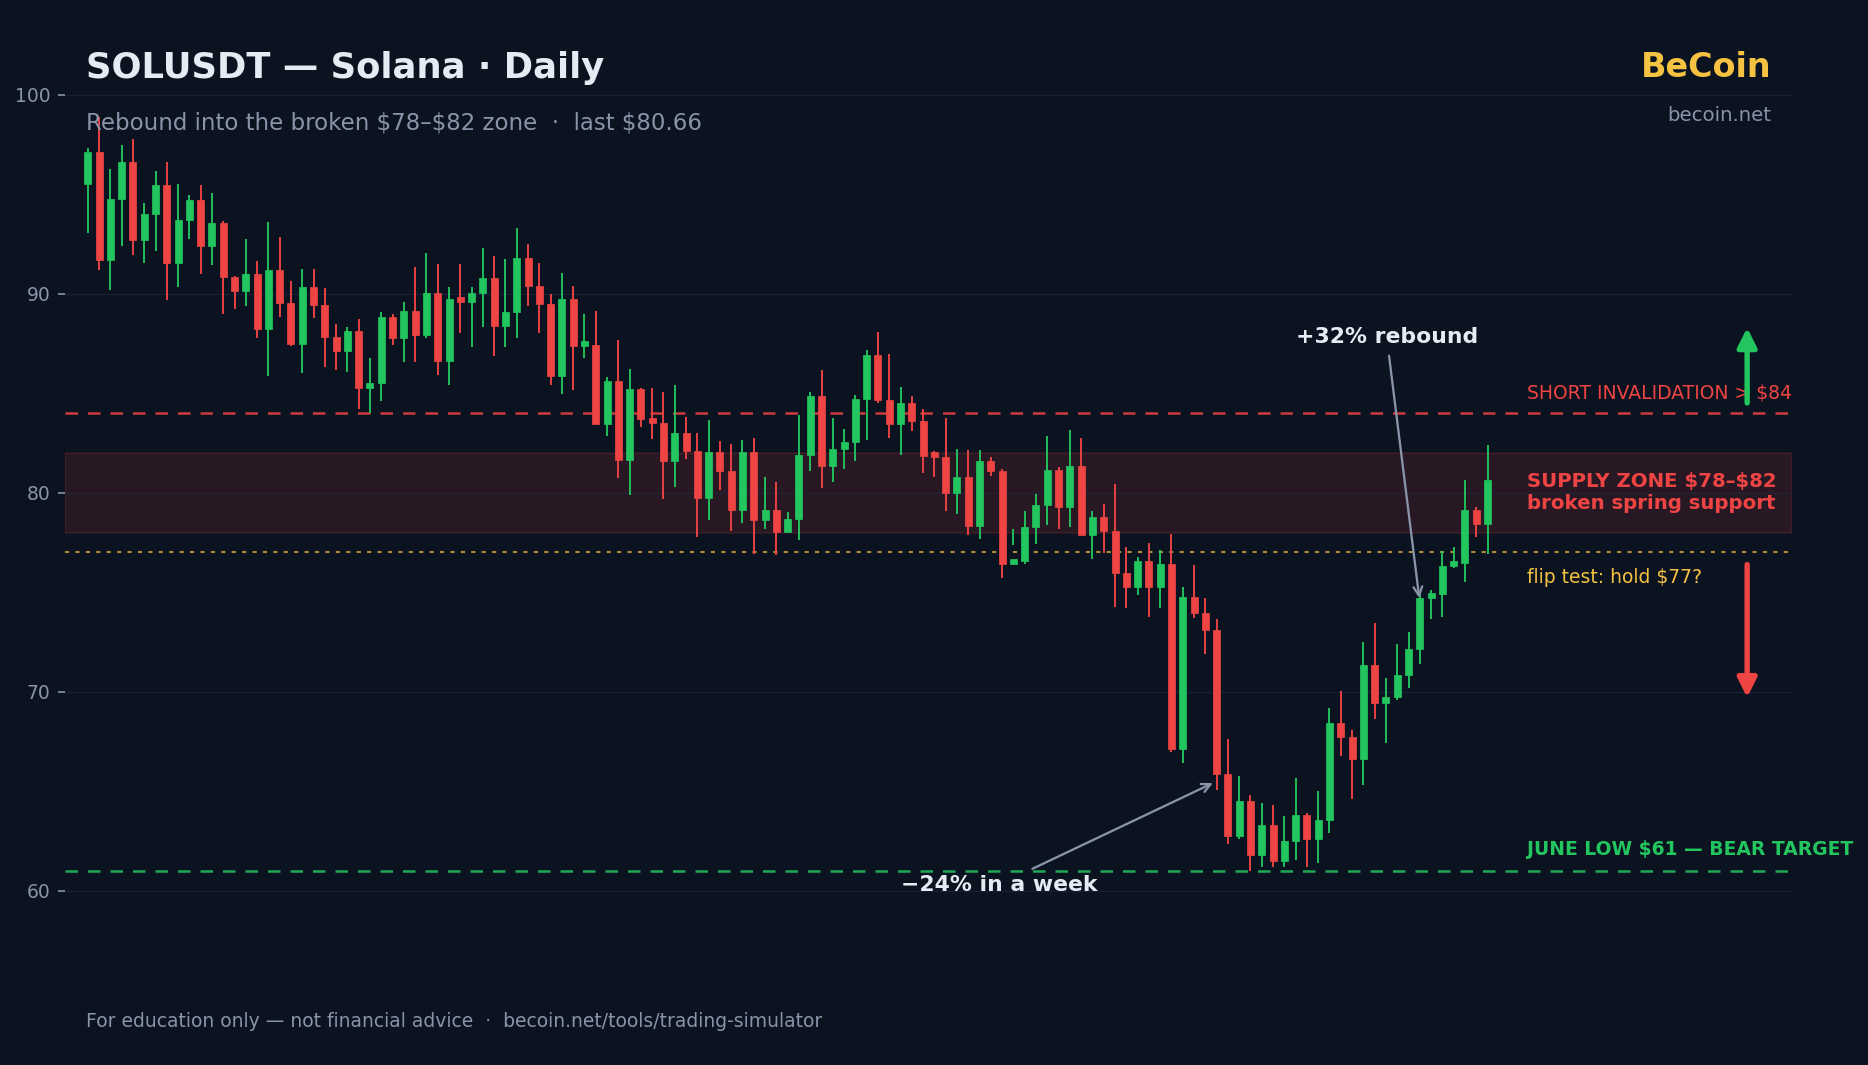
SOL rallied 32% off June's multi-year low near $61 straight into the broken $78–$82 support zone. We map the retest, the short thesis, the reclaim scenario, and the levels that decide it.
Tesla Beat Deliveries by 74,000 Vehicles — and Fell 7%. What the Chart Is Telling Traders
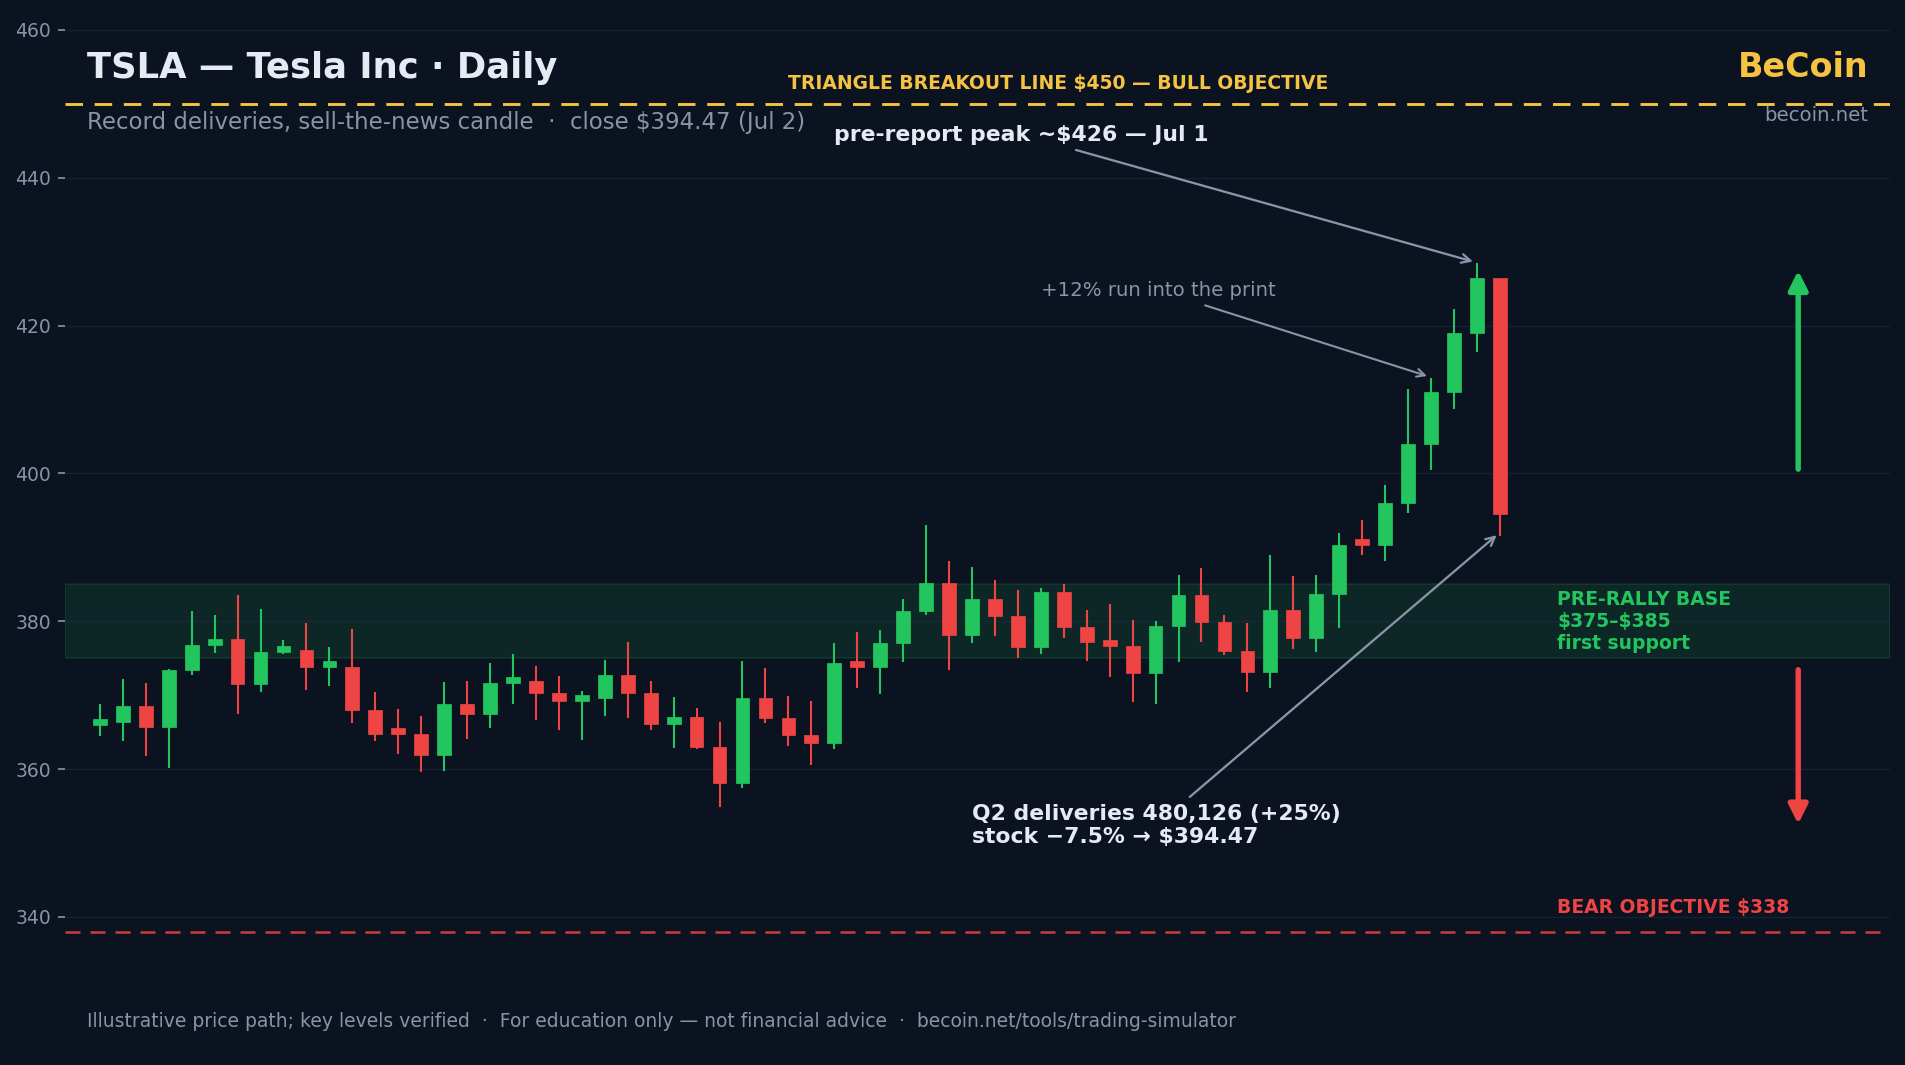
Tesla delivered 480,126 vehicles in Q2 — beating estimates by 74,000 — and still fell 7.5% to $394.47. We unpack the sell-the-news dynamics, the margin question, and the key levels ahead.
Gold Blasts Past $4,100 After Jobs Shock: Breakout or Trap?
Gold surged past $4,100 after a shock US jobs miss. We map the key levels, the bullish and bearish cases, and what traders should watch next — plus how to practice the setup risk-free.

Best Broker Without KYC (2026) — Truth + Risks Before You Choose
If you’re searching for the best broker without KYC, you likely want speed, low friction, and fast access to trading. But here’s the reality: Most traders don’t lose because of strategy.They lose because they choose the wrong platform early. No-KYC brokers can help you start quickly — but they also introduce hidden risks around withdrawals, […]
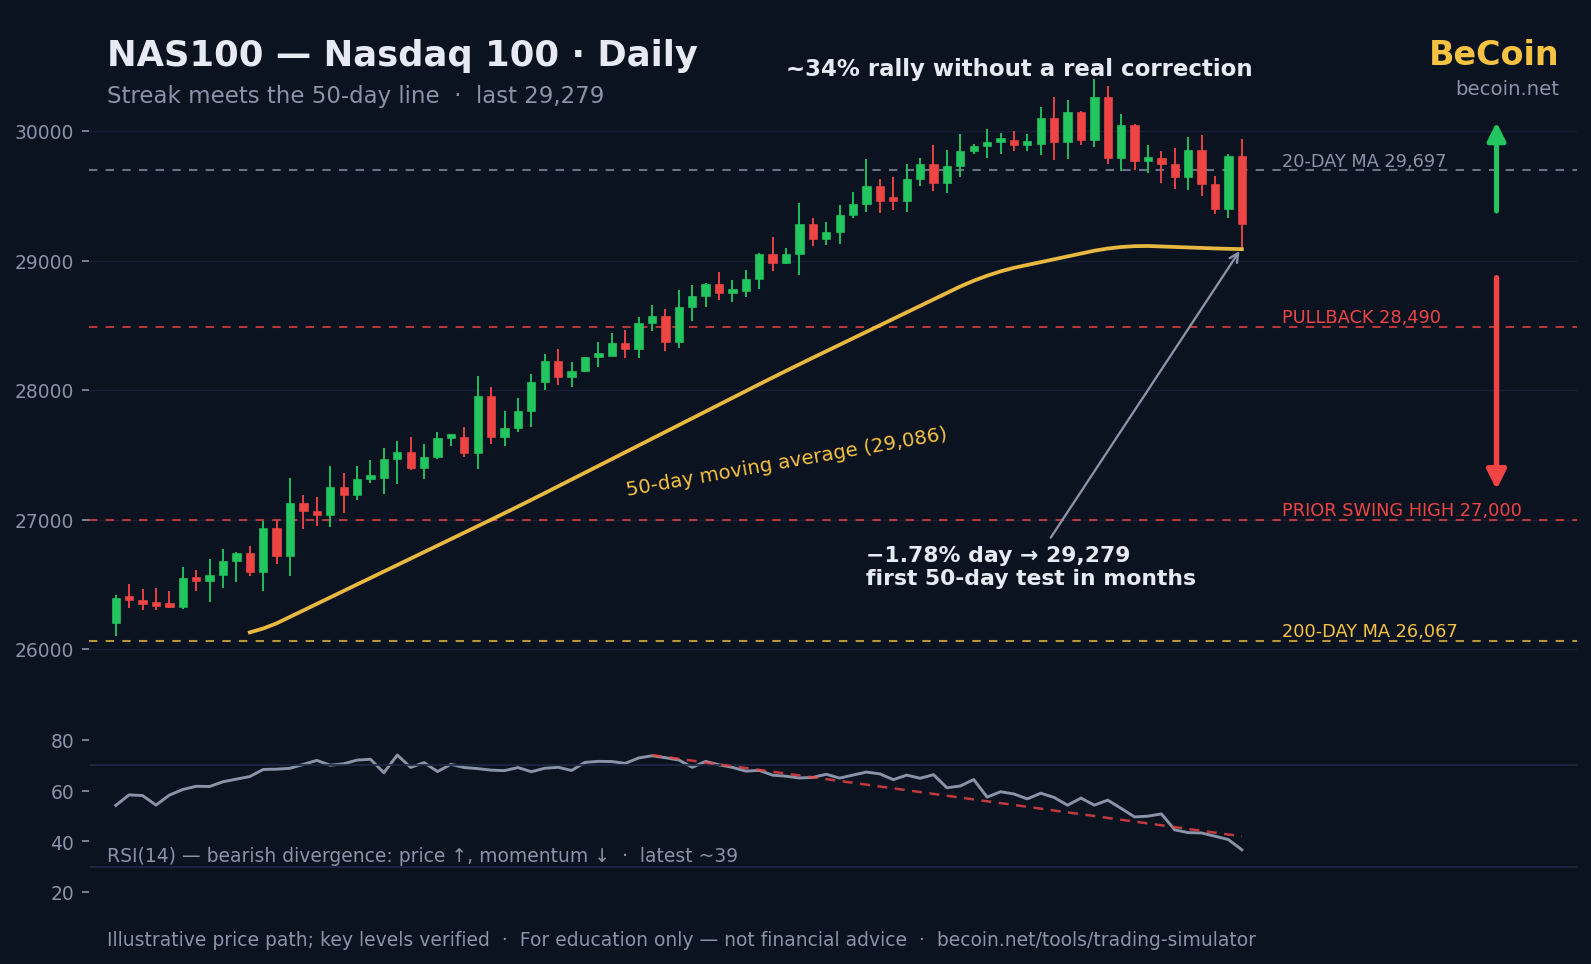
The Nasdaq's Relentless Rally Meets Its First Real Test
The Nasdaq 100 slipped to ~29,279, testing its 50-day average as chips sink and RSI diverges — while rate-cut hopes build. Key levels from 29,697 down to the 200-day at 26,067.
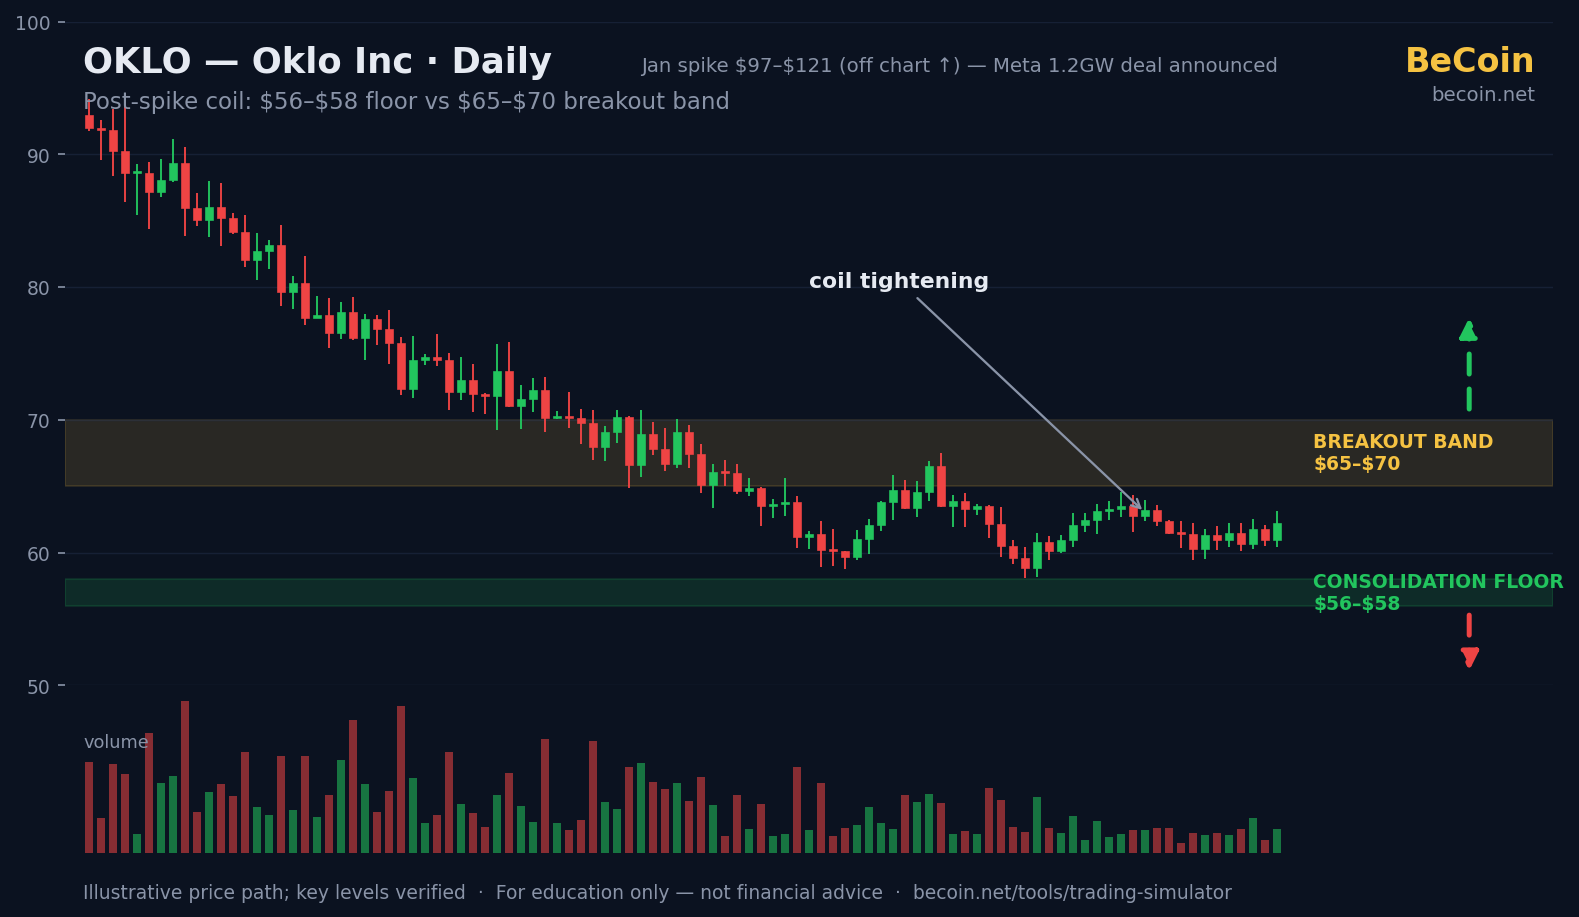
Oklo and the AI Power Trade: A Coiled Chart Meets a Hot Narrative
Oklo's Meta-backed 1.2GW nuclear deal validated the story, but the stock halved from January's spike into a tight $56–$70 range. We map the coil, both cases, and the breakout triggers.