Gold Blasts Past $4,100 After Jobs Shock: Breakout or Trap?
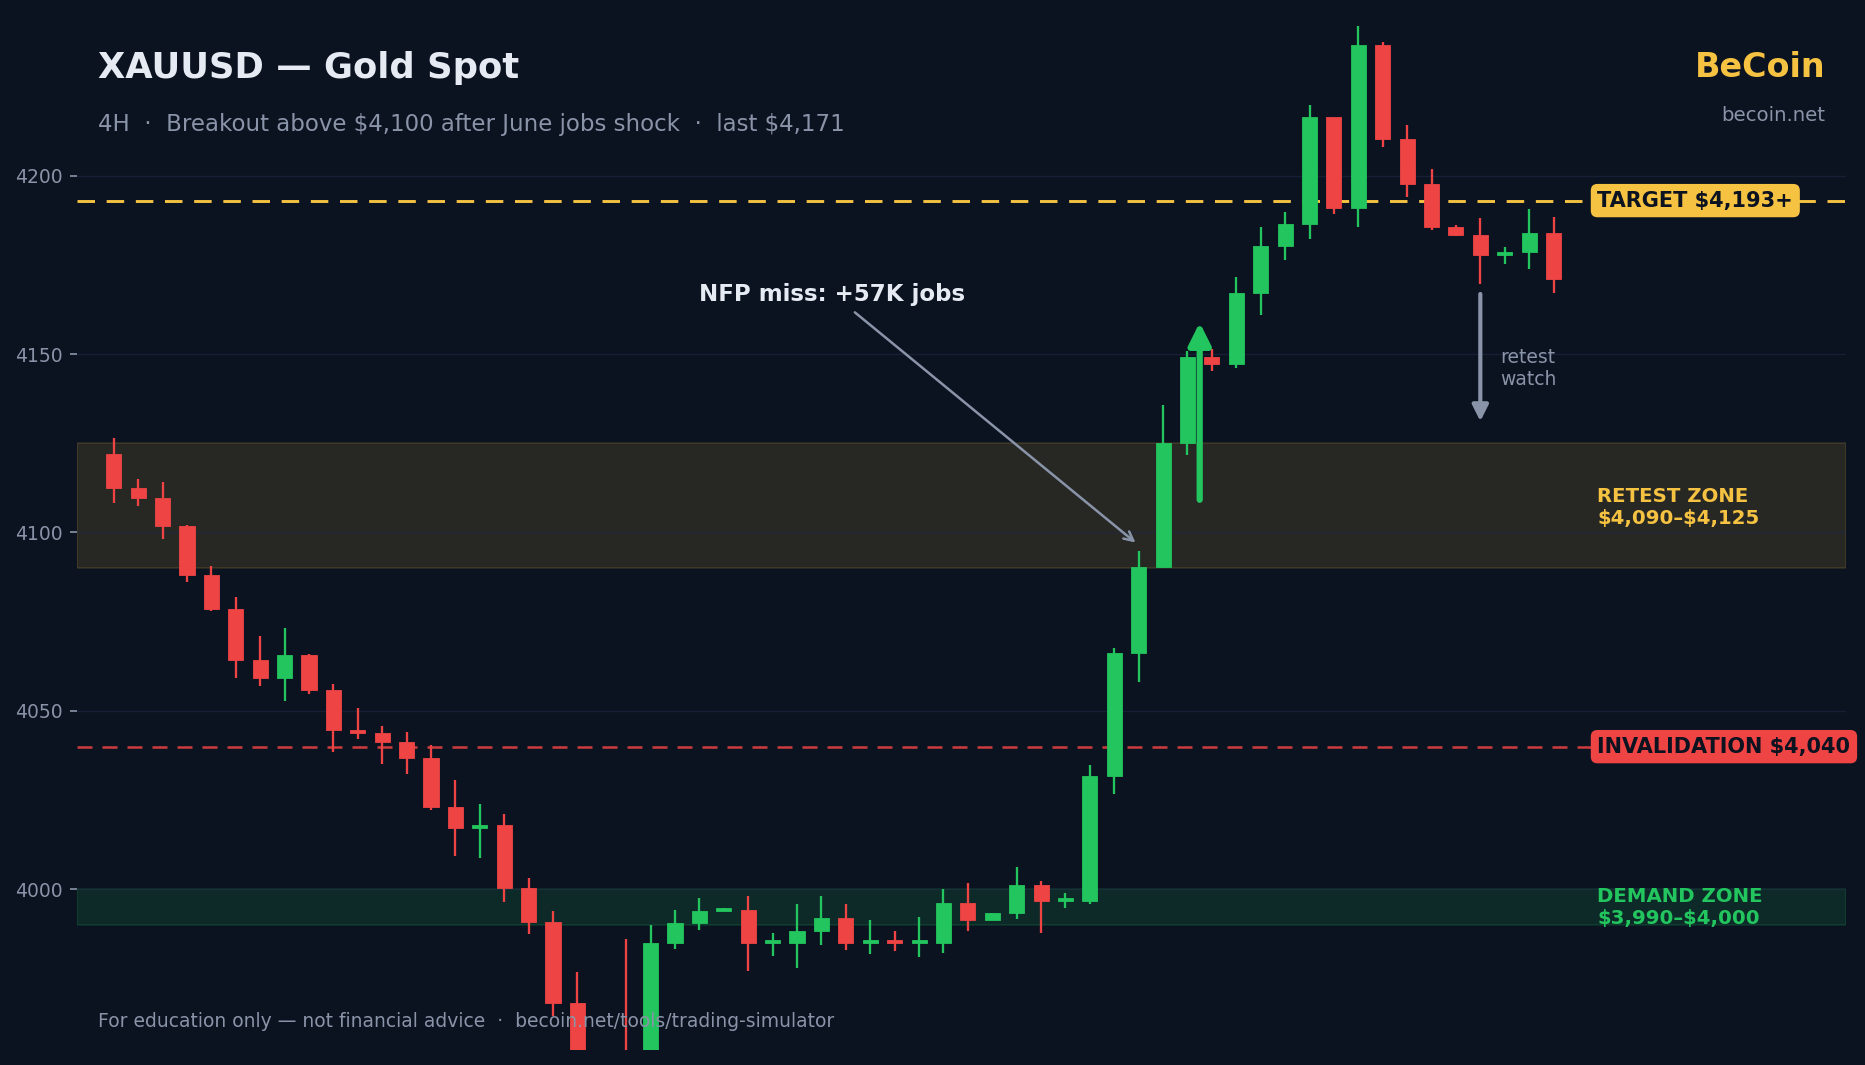
Gold just delivered the kind of move that splits a trading community in half. After grinding sideways under $4,100 for most of June, the metal ripped higher on July 2 when the US jobs report landed far below expectations — only 57,000 jobs added in June against a consensus of roughly 110,000, with downward revisions to prior months. Spot gold (XAUUSD) broke above $4,100, extended to an intraday high near $4,195 in the July 3 Asian session, and headed into the US holiday weekend trading around $4,170.
The question every gold trader is now arguing about: is this a genuine breakout, or a data-driven squeeze into resistance that bears will sell?
The Setup
For weeks, gold traded inside a broad consolidation after losing its multi-year uptrend line. Bears had control of the higher-timeframe structure, while bulls repeatedly defended the psychologically loaded $4,000 round number and the demand zone just below it around $3,990–3,997.
Then the June nonfarm payrolls miss changed the conversation. Weak hiring plus a falling participation rate pushed traders to reprice the Federal Reserve's path under new Chair Kevin Warsh, whose hawkish "higher-for-longer" stance had been keeping the dollar strong. A softer dollar is classic fuel for gold — and the market wasted no time using it.
The result is a fast, one-directional rally straight into the zone many chart watchers had flagged as the key upside barrier.
Key Levels to Know
- $4,195 — the post-jobs intraday high and the immediate ceiling.
- $4,090–$4,125 — the former resistance band gold just cut through. Bulls need this area to hold as support on any pullback; bears see it as the ideal fade zone.
- $4,040 — a widely watched pivot from the pre-breakout structure. Losing it would suggest the breakout is failing.
- $3,990–$4,000 — the round number plus the demand zone that launched the move. A return here would put the bearish, trendline-break scenario firmly back in play.
The Bullish Case
Bulls argue this is more than a knee-jerk reaction. The labor market is visibly cooling, rate expectations are shifting, and the dollar's months-long uptrend is showing its first real cracks. Gold cleared a heavily defended resistance band on strong momentum rather than drifting through it, and it did so while holding a well-defined higher-low structure off the $3,990 zone. If pullbacks now find buyers inside $4,090–$4,125 — old resistance acting as new support — the path toward $4,193+ and a retest of the broader range highs stays open.
The Bearish Case
Bears see a textbook trap. On the weekly chart, gold broke its long-term uptrend line earlier this year, and in their reading the entire recovery is a corrective rally inside a newer downtrend. Fast, news-driven spikes into major resistance are exactly where such rallies tend to die. Some harmonic traders have mapped reversal patterns completing in the $4,091–$4,122 area, with downside objectives near $4,011, then $3,974, and $3,923 below that. If Warsh reasserts a hawkish line and the dollar stabilizes, the single-catalyst rally could unwind as quickly as it appeared.
What Traders Should Watch Next
First, the retest. How gold behaves on its first meaningful dip into $4,090–$4,125 will say more than the breakout candle itself — acceptance above the band favors continuation, sharp rejection favors the trap scenario. Second, the follow-up US data: after one weak jobs print, markets will scrutinize the next inflation and employment releases for confirmation or contradiction. Third, Fed communication — any speech from Chair Warsh that pushes back on rate-cut pricing is a direct input into the dollar, and by extension gold. Finally, keep an eye on the $4,040 pivot; it is the line between "healthy pullback" and "failed breakout."
Conclusion
Gold's jump past $4,100 is a real technical event backed by a real macro catalyst — but it landed the price directly into the zone where the bear case begins. Breakout traders and fade traders are now staring at the same few hundred dollars of chart with opposite plans. Whichever side proves right, the levels are unusually well defined, which makes this one of the cleaner two-sided setups in the market right now.
Want to trade it without the risk? Test this setup in BeCoin's Trading Simulator: https://becoin.net/tools/trading-simulator — replay the breakout, set your entries at the retest, and see which scenario you would have survived.
Related: Gold's trendline break bear case.
Risk note: This article is for information and education only and is not financial or investment advice. Gold prices are volatile, levels referenced here can change quickly, and past patterns do not guarantee future outcomes. Always do your own research and never risk money you cannot afford to lose.
---
Yen at 40-Year Lows: Trading USDJPY Under Intervention Watch
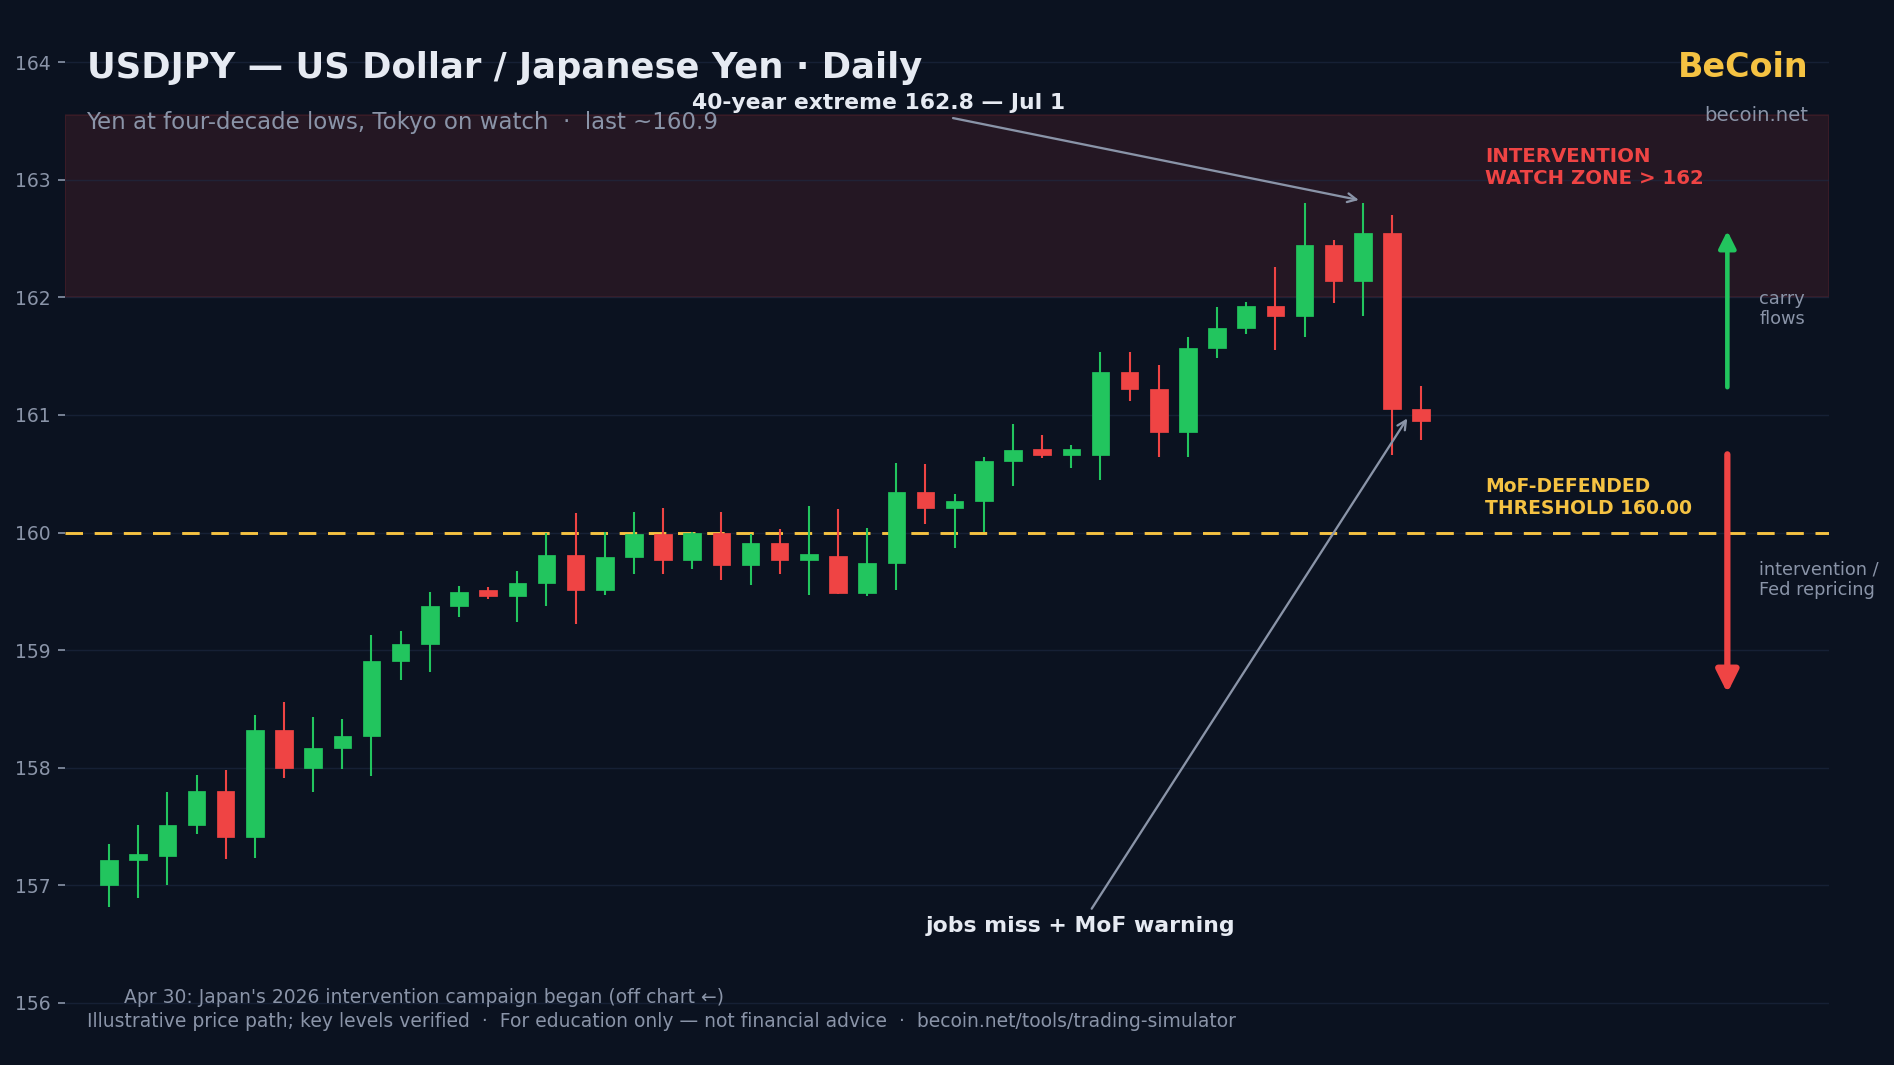
USDJPY hit 162.8 — the yen's weakest in four decades — then snapped back below 161 on weak US jobs and fresh intervention warnings from Tokyo. Key levels, both cases, and what to watch.
Ethereum at Yearly Lows: Accumulation Zone or Value Trap?
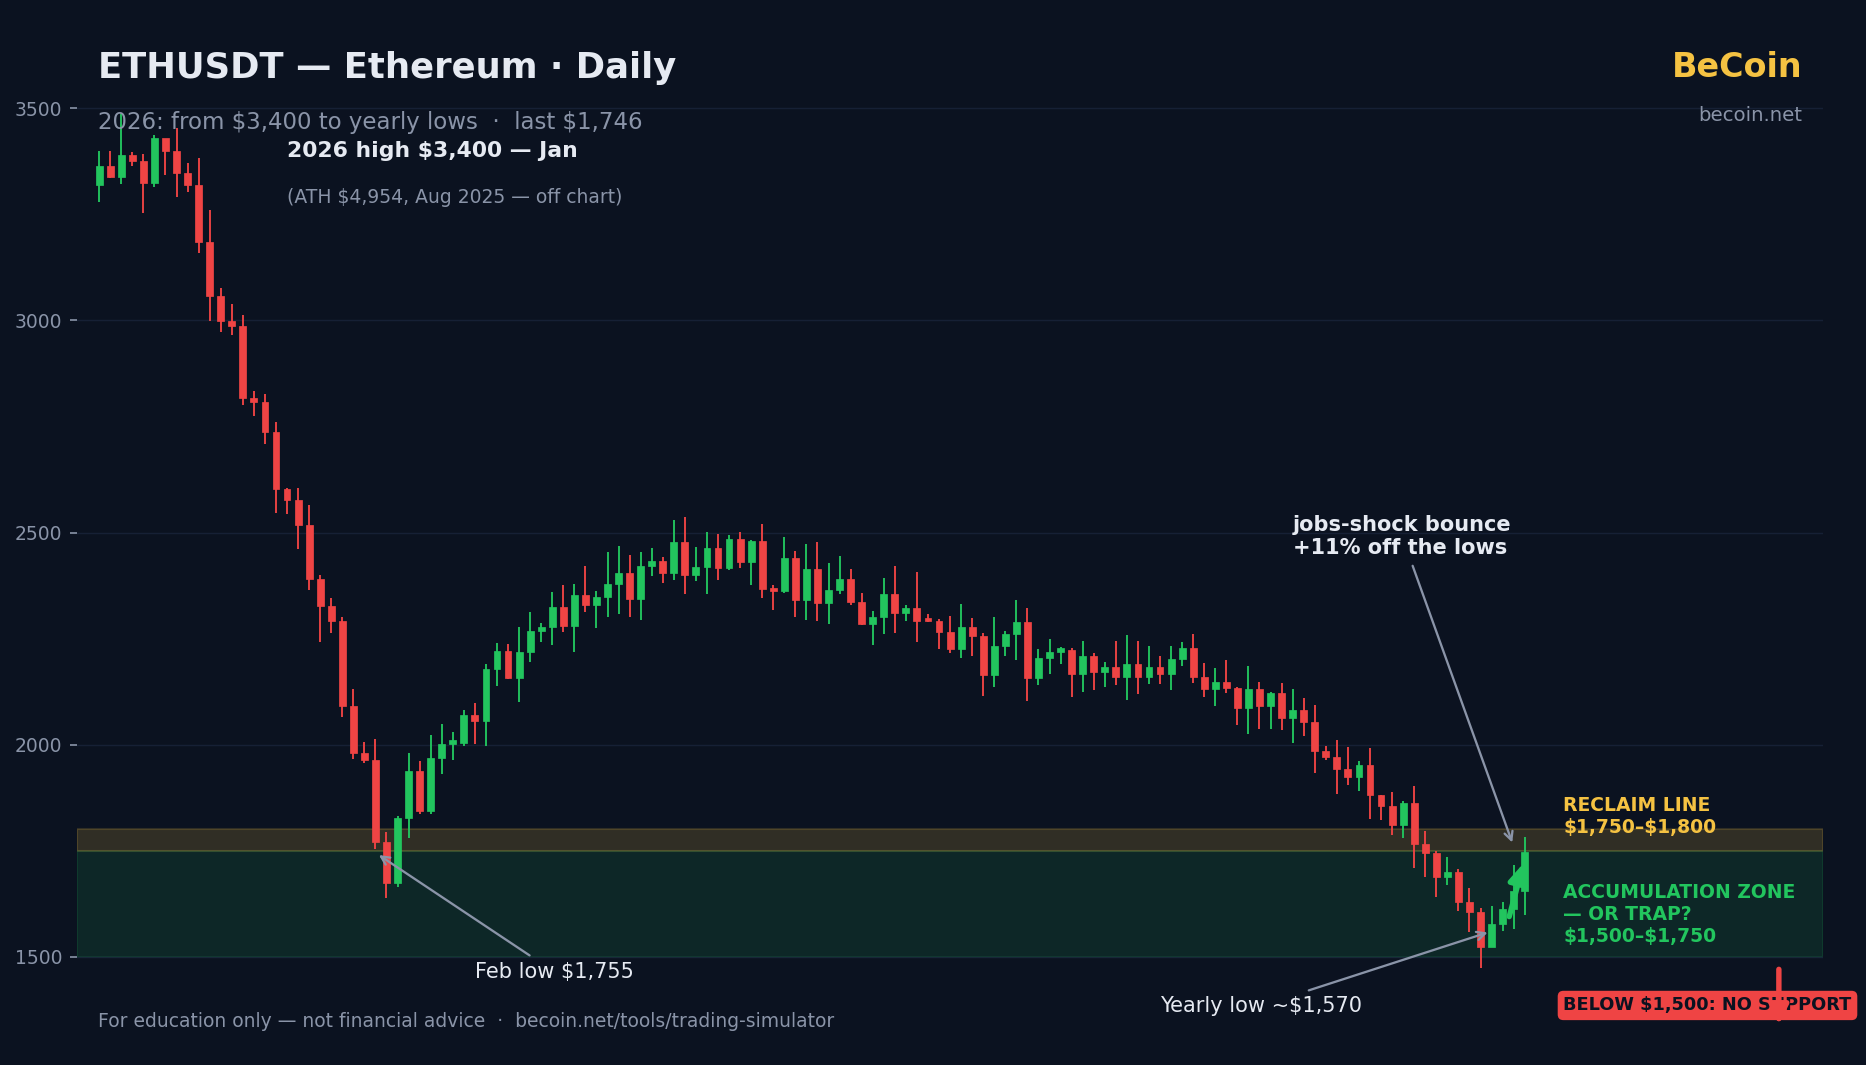
ETH bounced off yearly lows near $1,570 to $1,746 after the US jobs shock, still ~65% below its all-time high. We weigh the accumulation case against the value-trap case, level by level.
Gold's Multi-Year Trendline Just Broke — Why Some Traders Are Selling This Rally
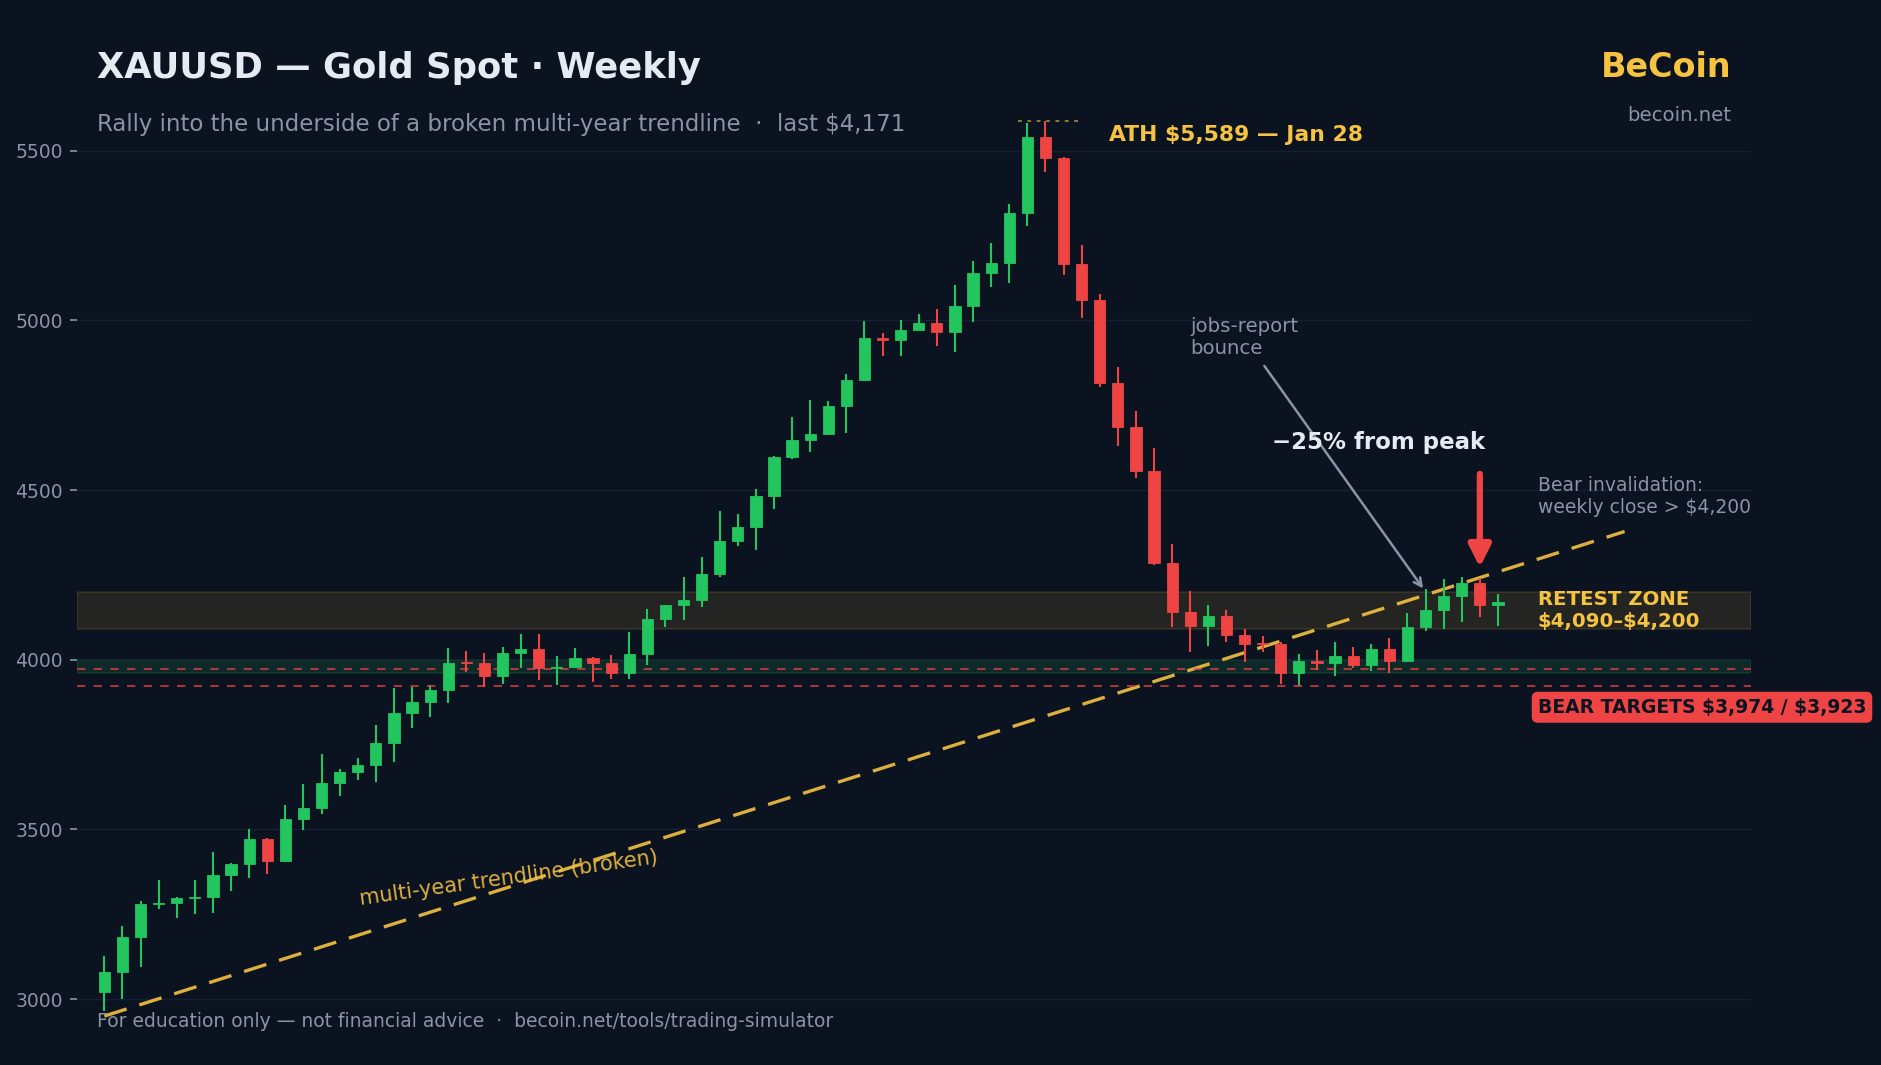
Gold rallied to $4,195, but the weekly chart shows a broken multi-year trendline and a 25% drawdown from January's $5,589 record. Here's the bear case, the key levels, and what would prove it wrong.
The Nasdaq's Relentless Rally Meets Its First Real Test
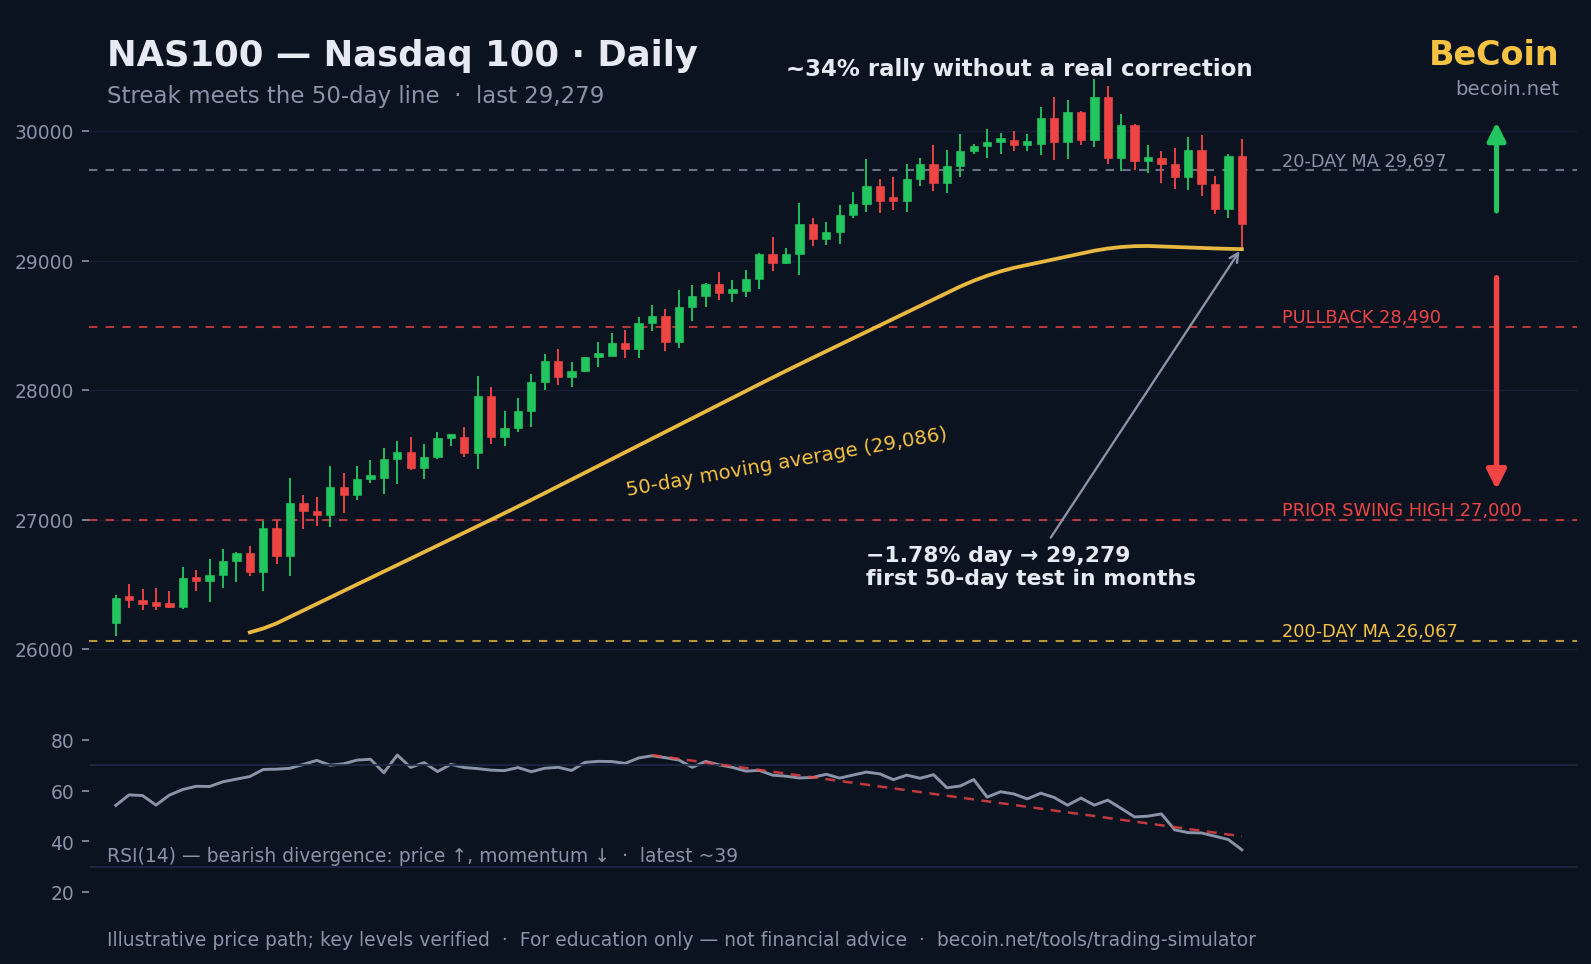
The Nasdaq 100 slipped to ~29,279, testing its 50-day average as chips sink and RSI diverges — while rate-cut hopes build. Key levels from 29,697 down to the 200-day at 26,067.
Oklo and the AI Power Trade: A Coiled Chart Meets a Hot Narrative
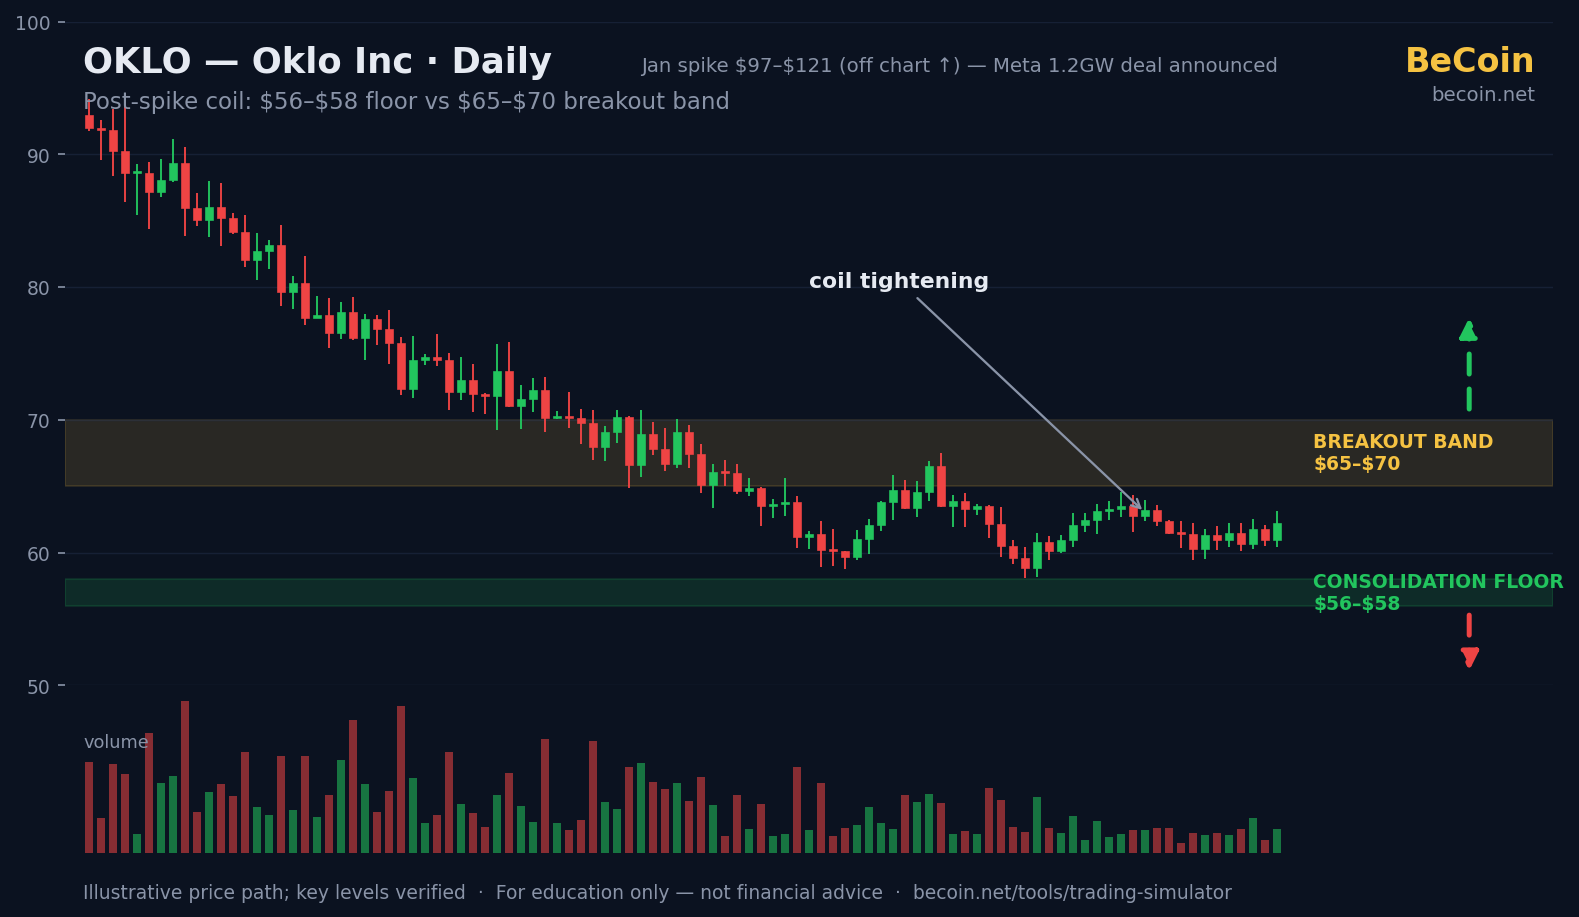
Oklo's Meta-backed 1.2GW nuclear deal validated the story, but the stock halved from January's spike into a tight $56–$70 range. We map the coil, both cases, and the breakout triggers.
Micron's Parabolic Year: From the $1 Trillion Club to a 20% Air Pocket
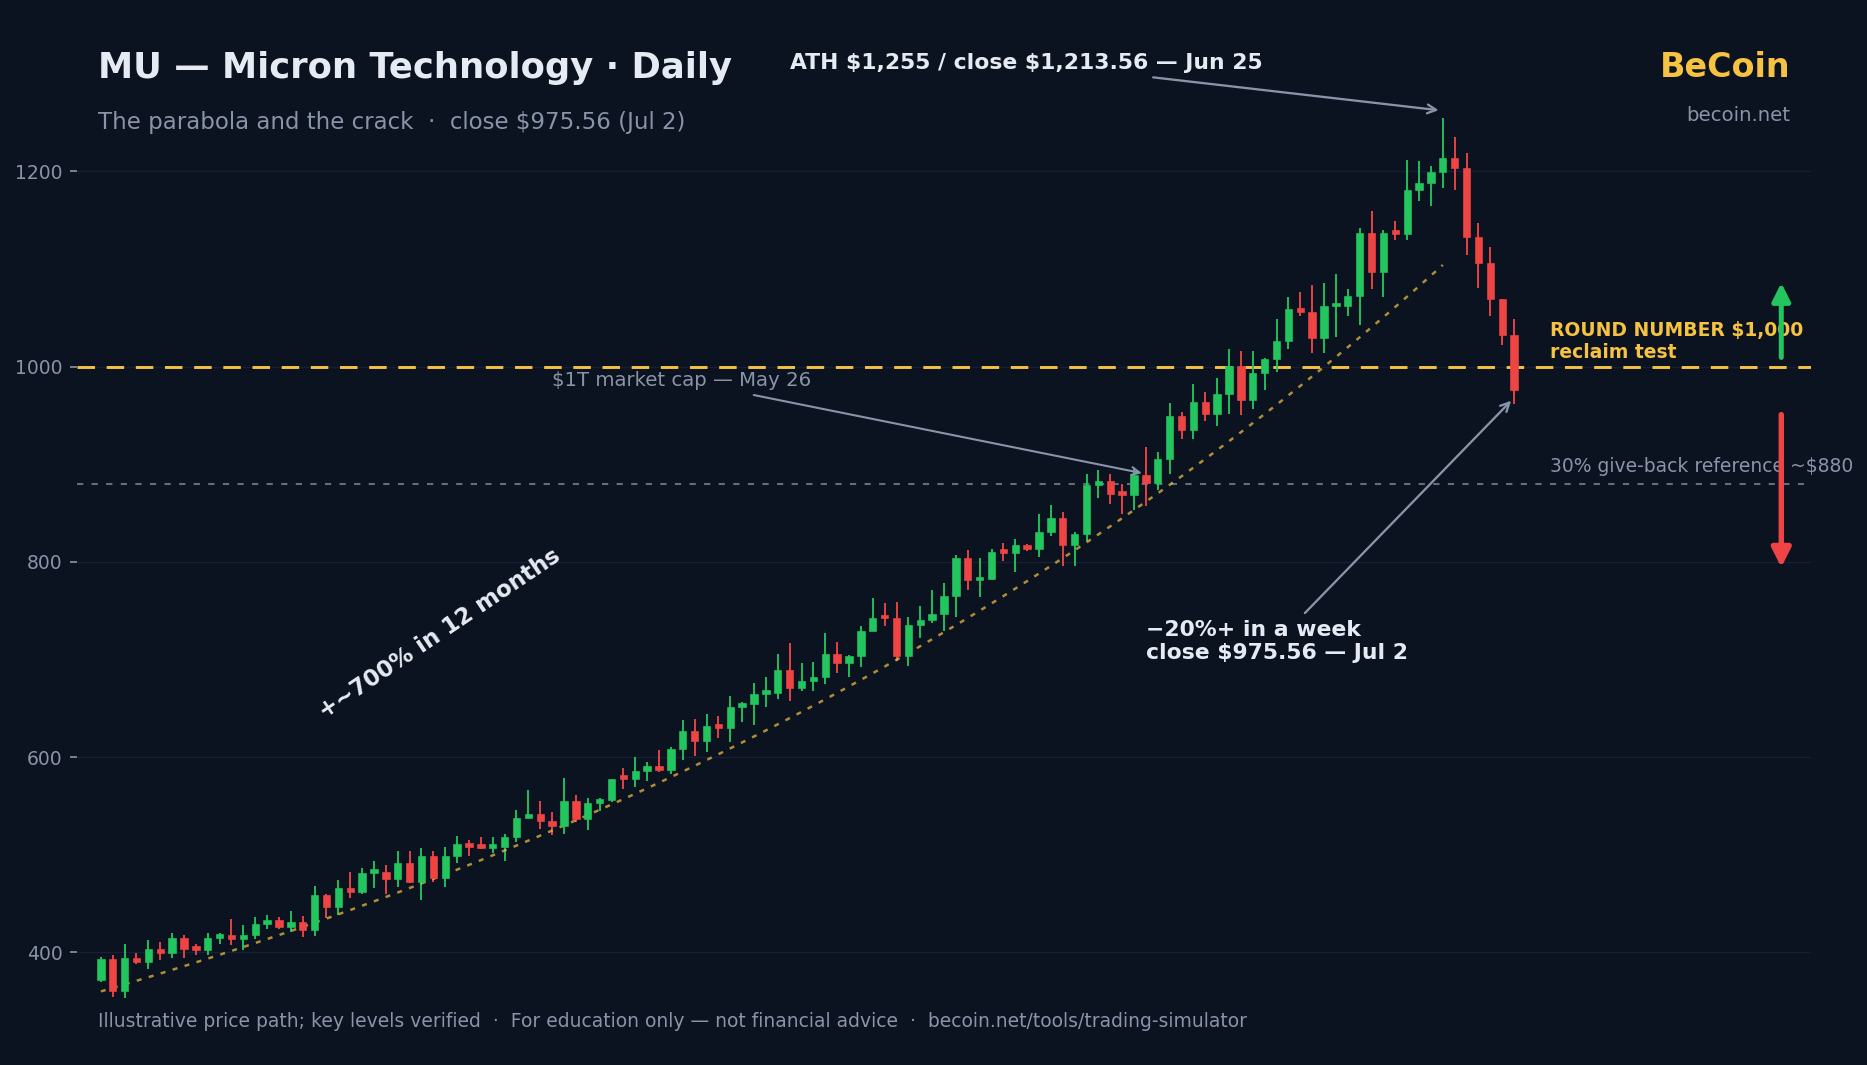
Micron rose ~700% in a year, joined the $1T club, then dropped 20% in a week to $975. We map the $1,000 battleground, the blow-off-top debate, and the levels that decide what comes next.