Micron's Parabolic Year: From the $1 Trillion Club to a 20% Air Pocket
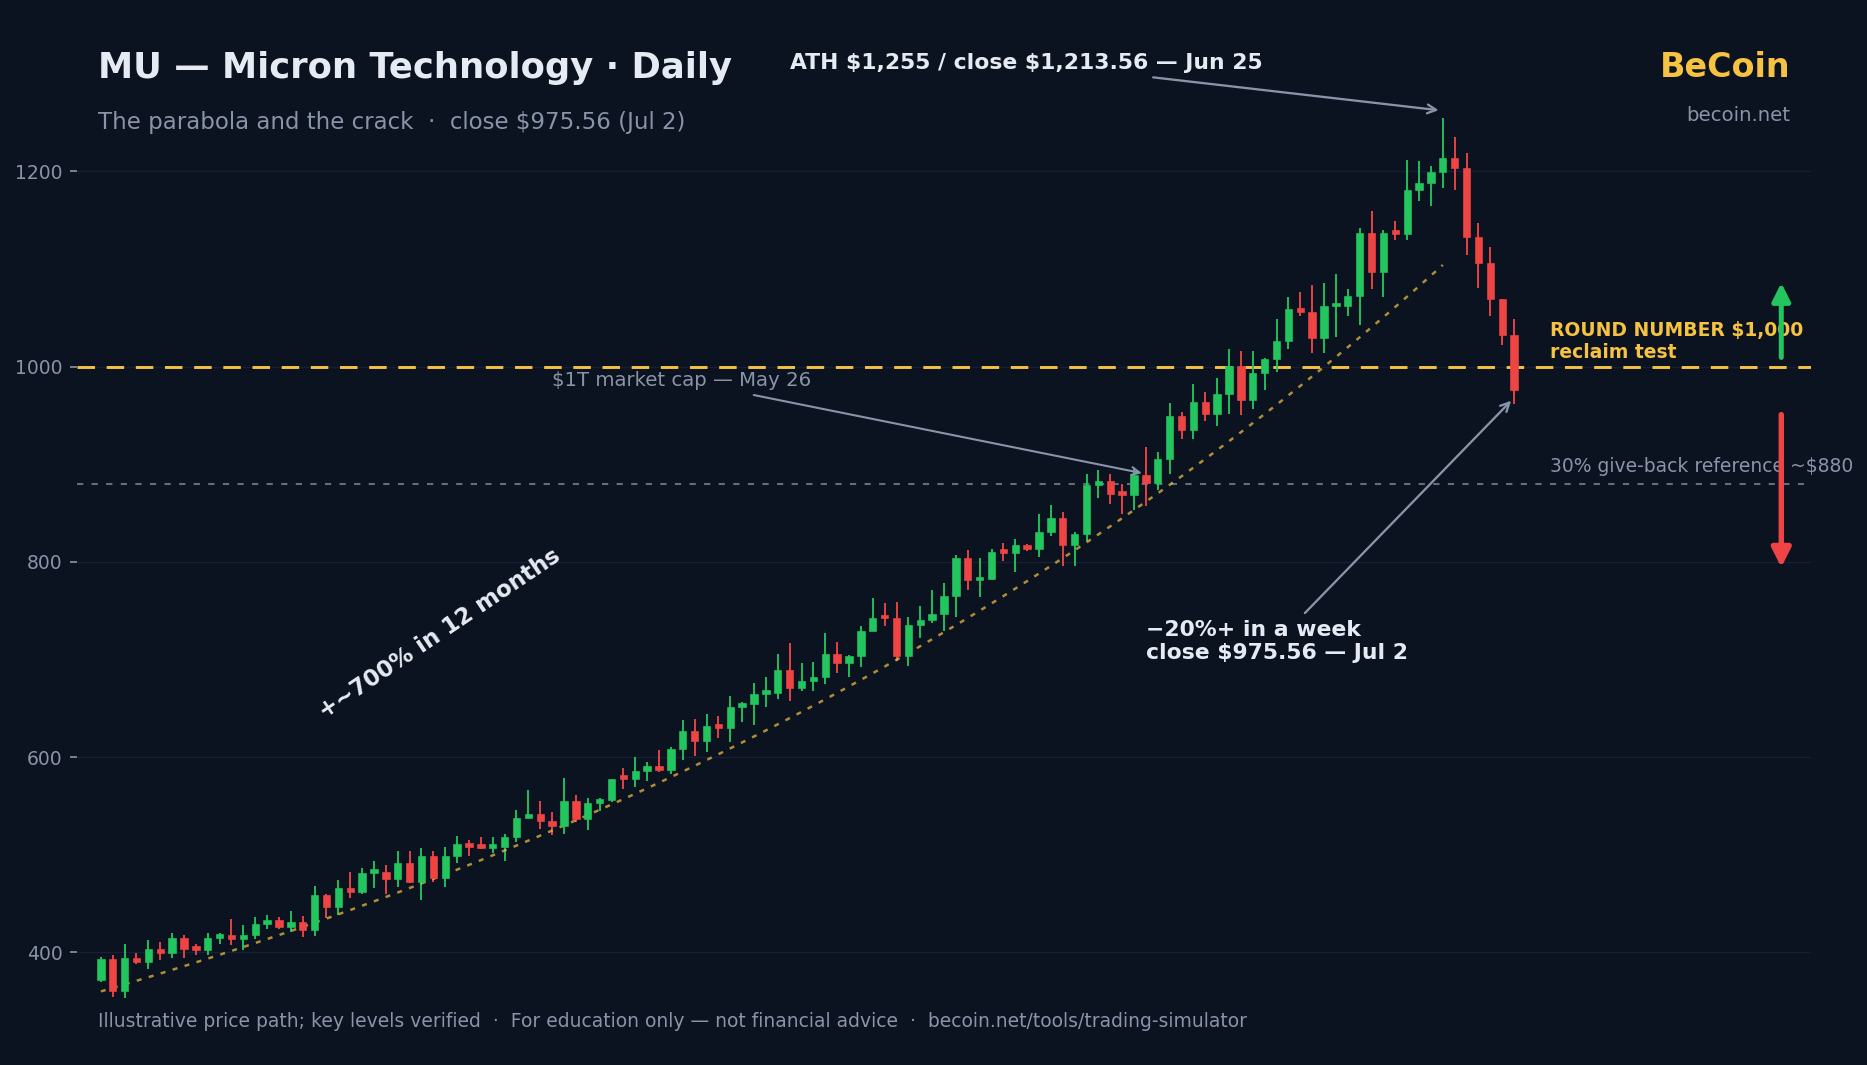
A year ago, Micron traded near $103. On June 25, it closed at $1,213.56 — an all-time high capping a gain of roughly 700% in twelve months, a run that made it one of the fastest entrants ever into the $1 trillion market-cap club (reached May 26). Then, in a single week, the stock gave back more than 20%, closing July 2 at $975.56 after a 5.5% daily drop — below the $1,000 round number, with intraday extremes as high as $1,255 still fresh on the chart.
Parabolas are the market's most spectacular and most treacherous structures. Micron's is now cracking — or breathing, depending on whom you ask. Here's how traders read a chart like this without pretending to know the top.
The Setup
The fundamentals behind the run are real and historic: an unprecedented profit cycle driven by high-bandwidth memory (HBM), where AI datacenter demand has collided with constrained supply to produce record margins in what was once a brutally cyclical commodity business. Analysts remain broadly positive, with a consensus Buy rating.
But June brought the classic late-parabola cocktail. Broadcom's June 6 guidance disappointment cracked the chip complex (SOXX fell ~10% that day), the "rising AI infrastructure cost" narrative spread, and momentum names started moving down harder than their news flow justified. Micron — the sector's most vertical chart — became the pressure release valve, falling over 10% in single sessions on its worst days. Among traders, sentiment turned into open debate: multiple independent chartists began calling the move a potential blow-off top, with one viral take arguing that buying MU here would get a professional trader fired.
Key Levels to Know
- $1,255 — the intraday all-time high, the top of the parabola.
- $1,213.56 — the record close (June 25); the reference point for the current drawdown.
- $1,000 — the round number the stock just lost; the first thing bulls must reclaim.
- $975.56 — the July 2 close, roughly 20–22% below the peak — already standard "correction" territory in a single week.
- ~$880 — arithmetic reference: a 30% give-back from the intraday peak, a common depth for post-parabola resets; not a chart level so much as a sanity marker.
The Bullish Case
Bulls argue the drawdown is the cost of admission, not a verdict. The HBM cycle's earnings power is still accelerating, and a 20% drop in a stock that rose 700% barely registers on the higher-timeframe trend — the price is merely back to late-May levels, near where the trillion-dollar milestone was celebrated. Parabolic stocks routinely shed 20–30% multiple times during their runs, punishing leveraged momentum chasers while the trend survives. Reclaiming $1,000 quickly — especially on an earnings confirmation of the memory cycle — would mark this as the reset that refueled the move.
The Bearish Case
Bears counter that every blow-off top in history looked exactly like this from the inside: unassailable fundamentals, a vertical chart, and a first crack dismissed as healthy. The steeper the climb, the less support exists below — Micron's chart has almost no memory between here and much lower prices, because it spent so little time at each level on the way up. Memory remains a cyclical business at heart; when HBM supply catches demand, margin reversion tends to arrive faster than consensus expects. And mechanically, a momentum stock that loses its momentum loses its largest buyer — the trend-followers themselves. Below the mid-$900s, bears argue, the air pocket extends much deeper than most holders imagine.
What Traders Should Watch Next
The $1,000 level is the immediate scoreboard — a swift reclaim keeps the parabola alive, repeated rejections confirm distribution. Watch the character of the bounces: narrow, low-volume rallies after vertical drops are the bear signature. The next earnings report and any HBM supply-demand commentary (from Micron or its Korean rivals) is the fundamental checkpoint that decides whether the cycle thesis is intact. And watch the sector: Micron's fate is now tied to how the broader chip selloff resolves — it will not bottom alone.
Conclusion
Micron's year is already one for the history books: 700% up, a trillion-dollar badge, and now the sharpest test of the entire run. Nobody rings a bell at parabola tops — but the market has drawn its lines clearly: $1,000 above, the thin air below, and an earnings cycle that will settle the argument in fundamentals rather than adjectives.
Parabolas are unforgiving teachers — take the lesson without the tuition. Test this setup in BeCoin's Trading Simulator: https://becoin.net/tools/trading-simulator — trade the reclaim, the rejection, or the sidelines, and learn how you handle a 20% air pocket.
Related: NVIDIA below $200 and Nasdaq 100's 50-day test.
Risk note: This article is for information and education only and is not financial or investment advice. Extremely volatile momentum stocks can fall or rise dramatically in short periods; drawdowns can extend far beyond typical historical patterns. Always do your own research and never risk money you cannot afford to lose.
---
Solana's $80 Supply Zone: Why Traders Are Watching This Retest
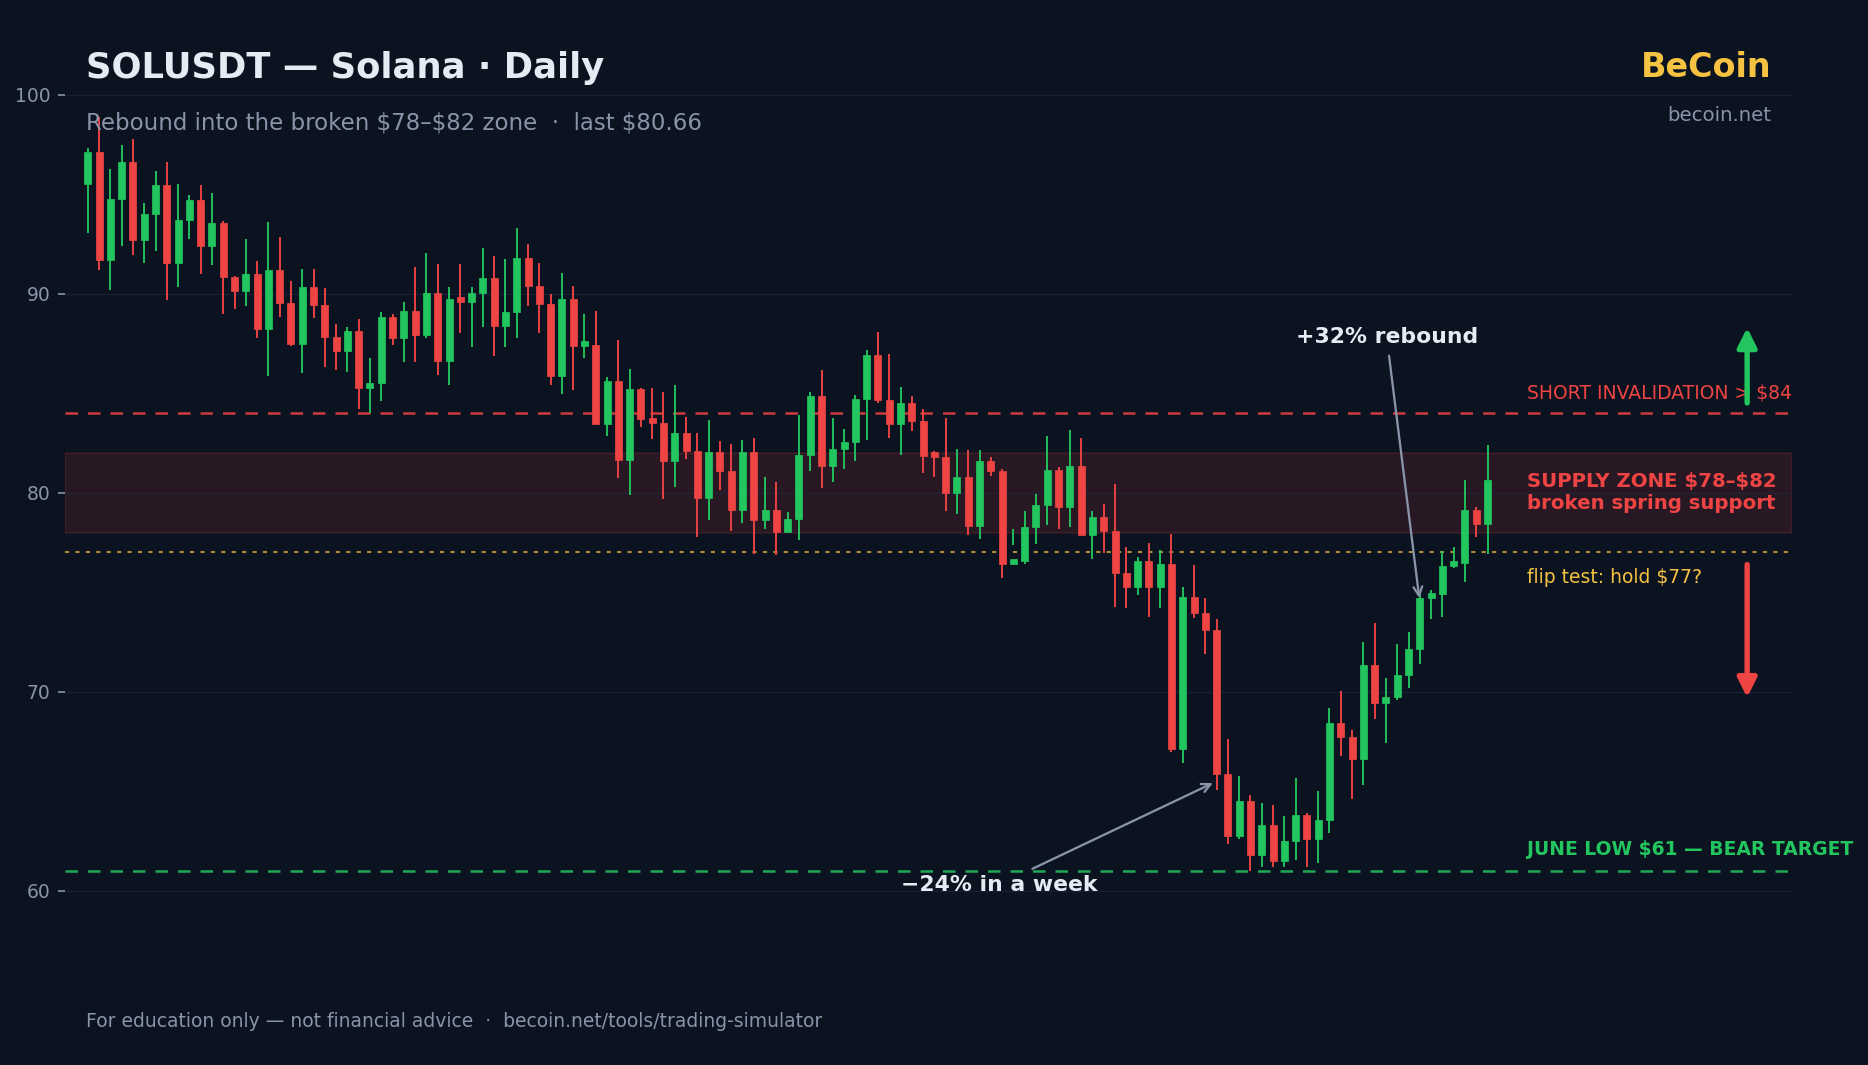
SOL rallied 32% off June's multi-year low near $61 straight into the broken $78–$82 support zone. We map the retest, the short thesis, the reclaim scenario, and the levels that decide it.
Gold Blasts Past $4,100 After Jobs Shock: Breakout or Trap?
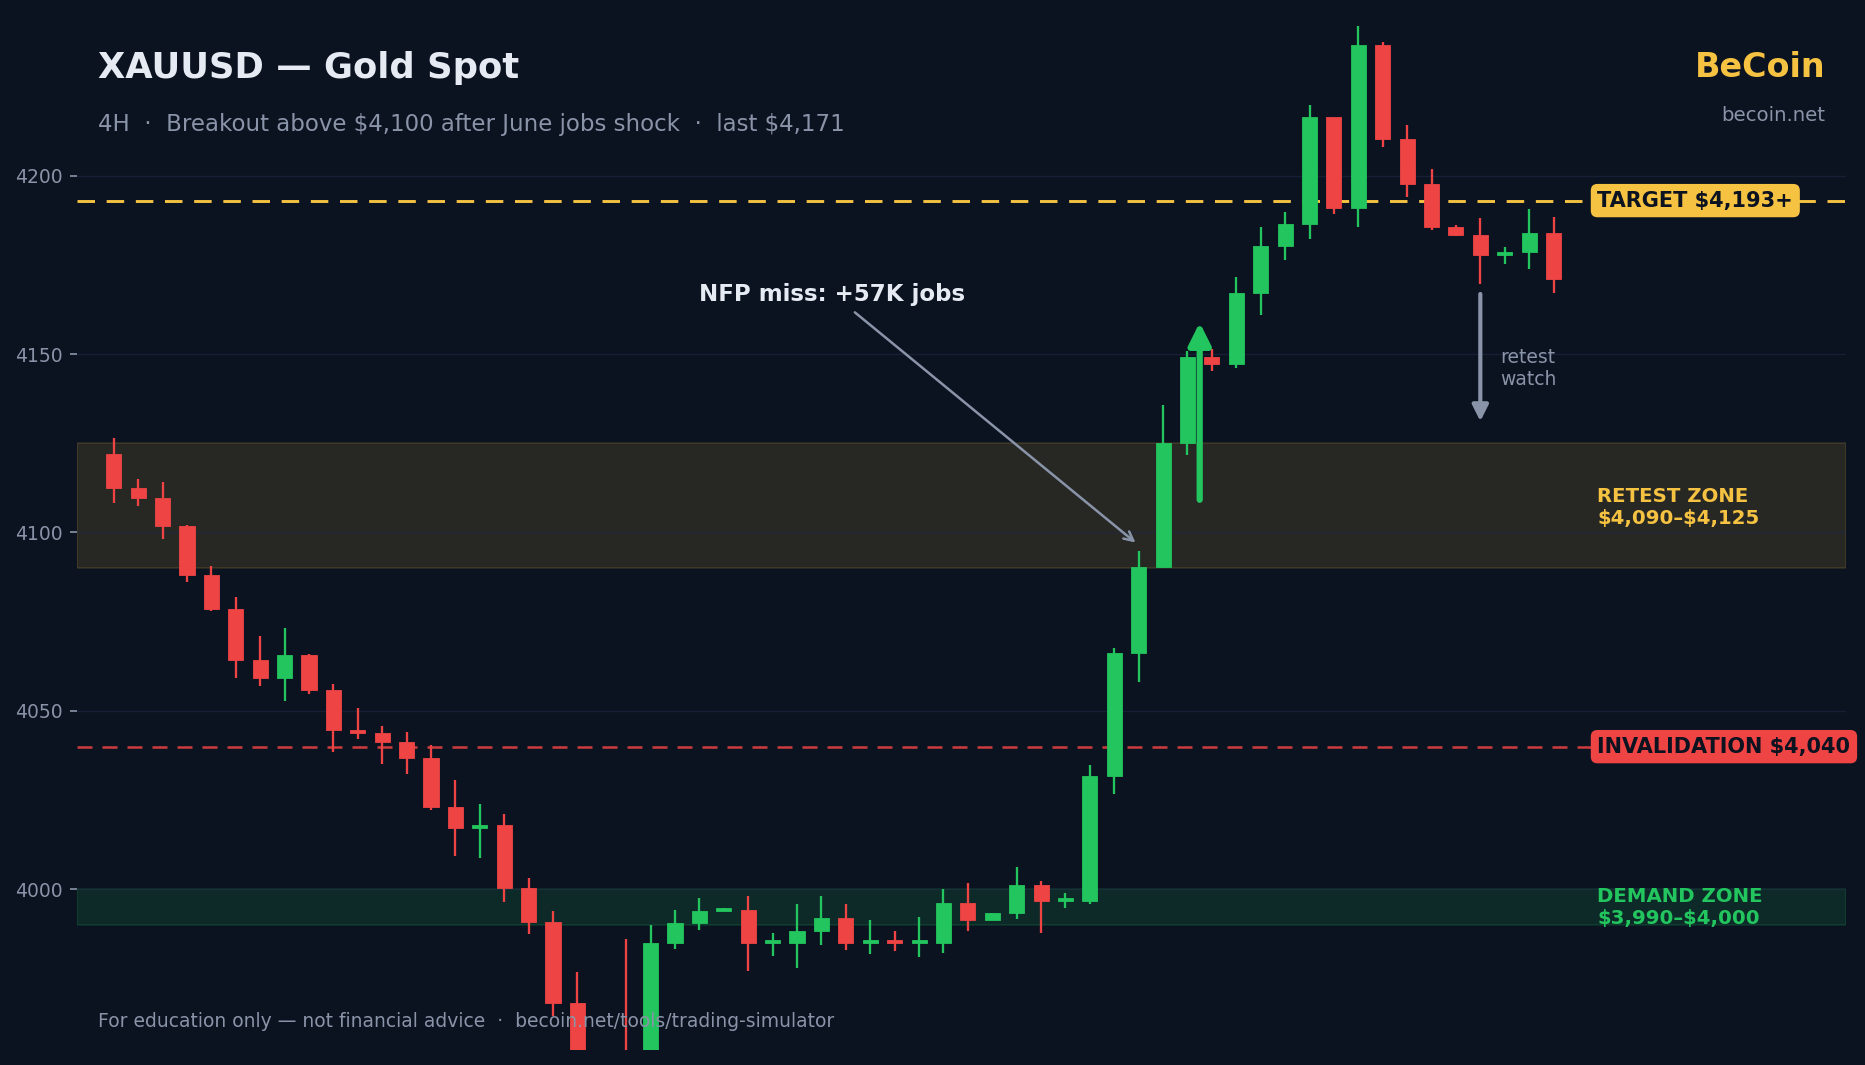
Gold surged past $4,100 after a shock US jobs miss. We map the key levels, the bullish and bearish cases, and what traders should watch next — plus how to practice the setup risk-free.
Tesla Beat Deliveries by 74,000 Vehicles — and Fell 7%. What the Chart Is Telling Traders
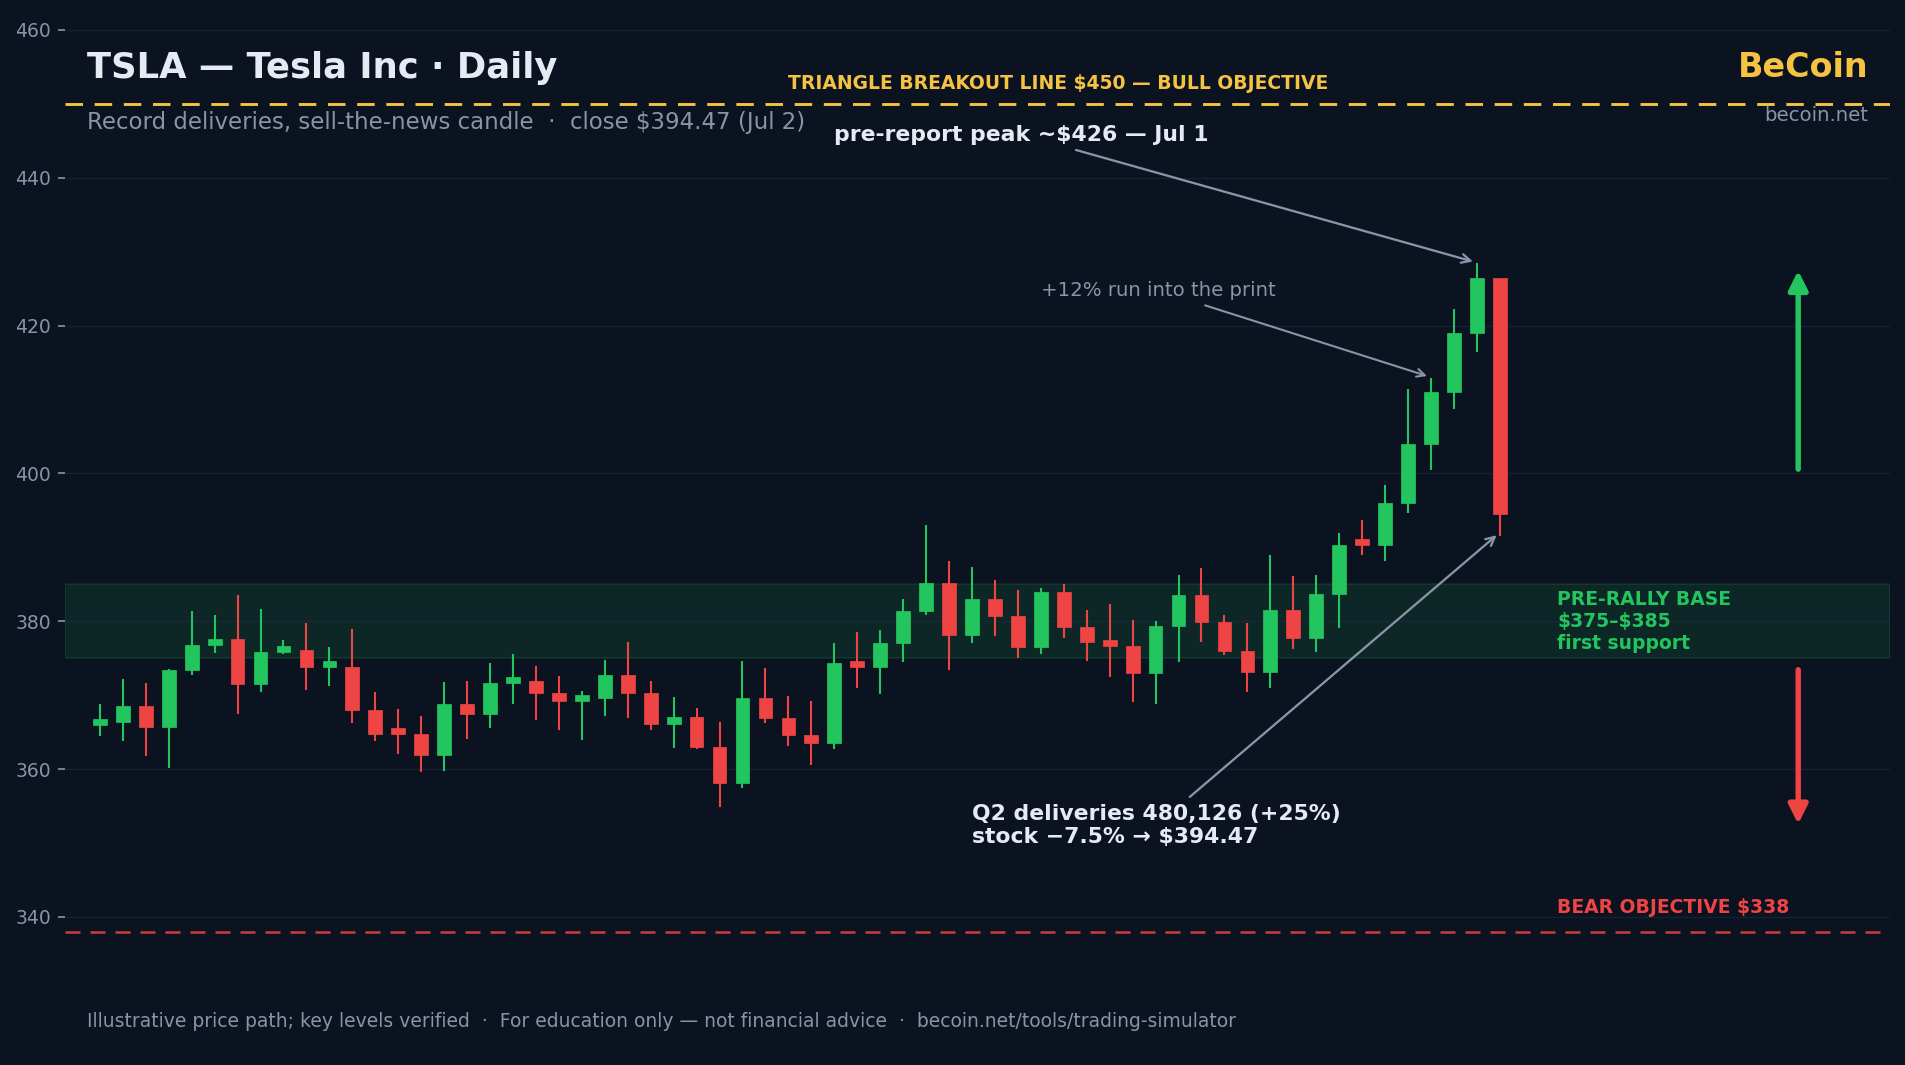
Tesla delivered 480,126 vehicles in Q2 — beating estimates by 74,000 — and still fell 7.5% to $394.47. We unpack the sell-the-news dynamics, the margin question, and the key levels ahead.
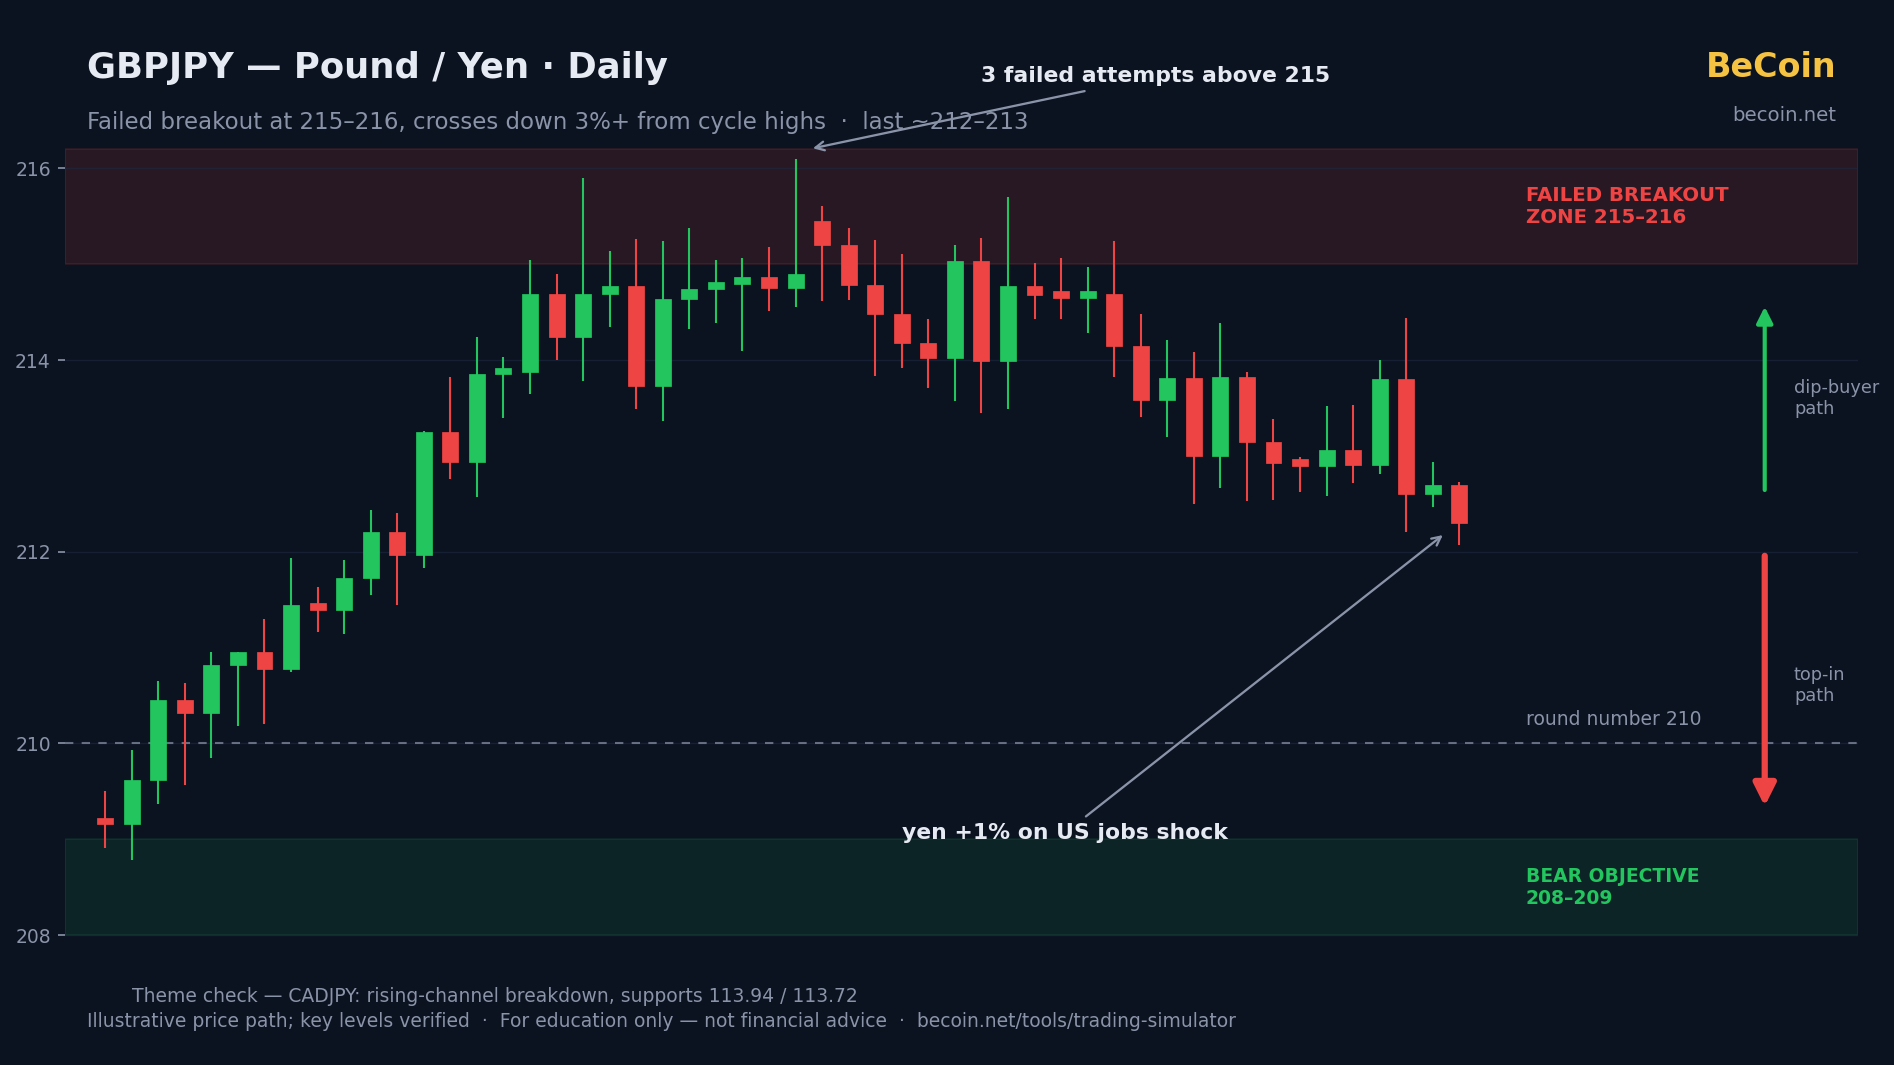
The Yen Trade Everyone's Watching: Are JPY Crosses Topping First?
EURJPY, GBPJPY and CADJPY have dropped 3%+ from cycle highs while USDJPY made new extremes. We map GBPJPY's failed breakout at 215, CADJPY's channel break, and what decides the yen reversal trade.
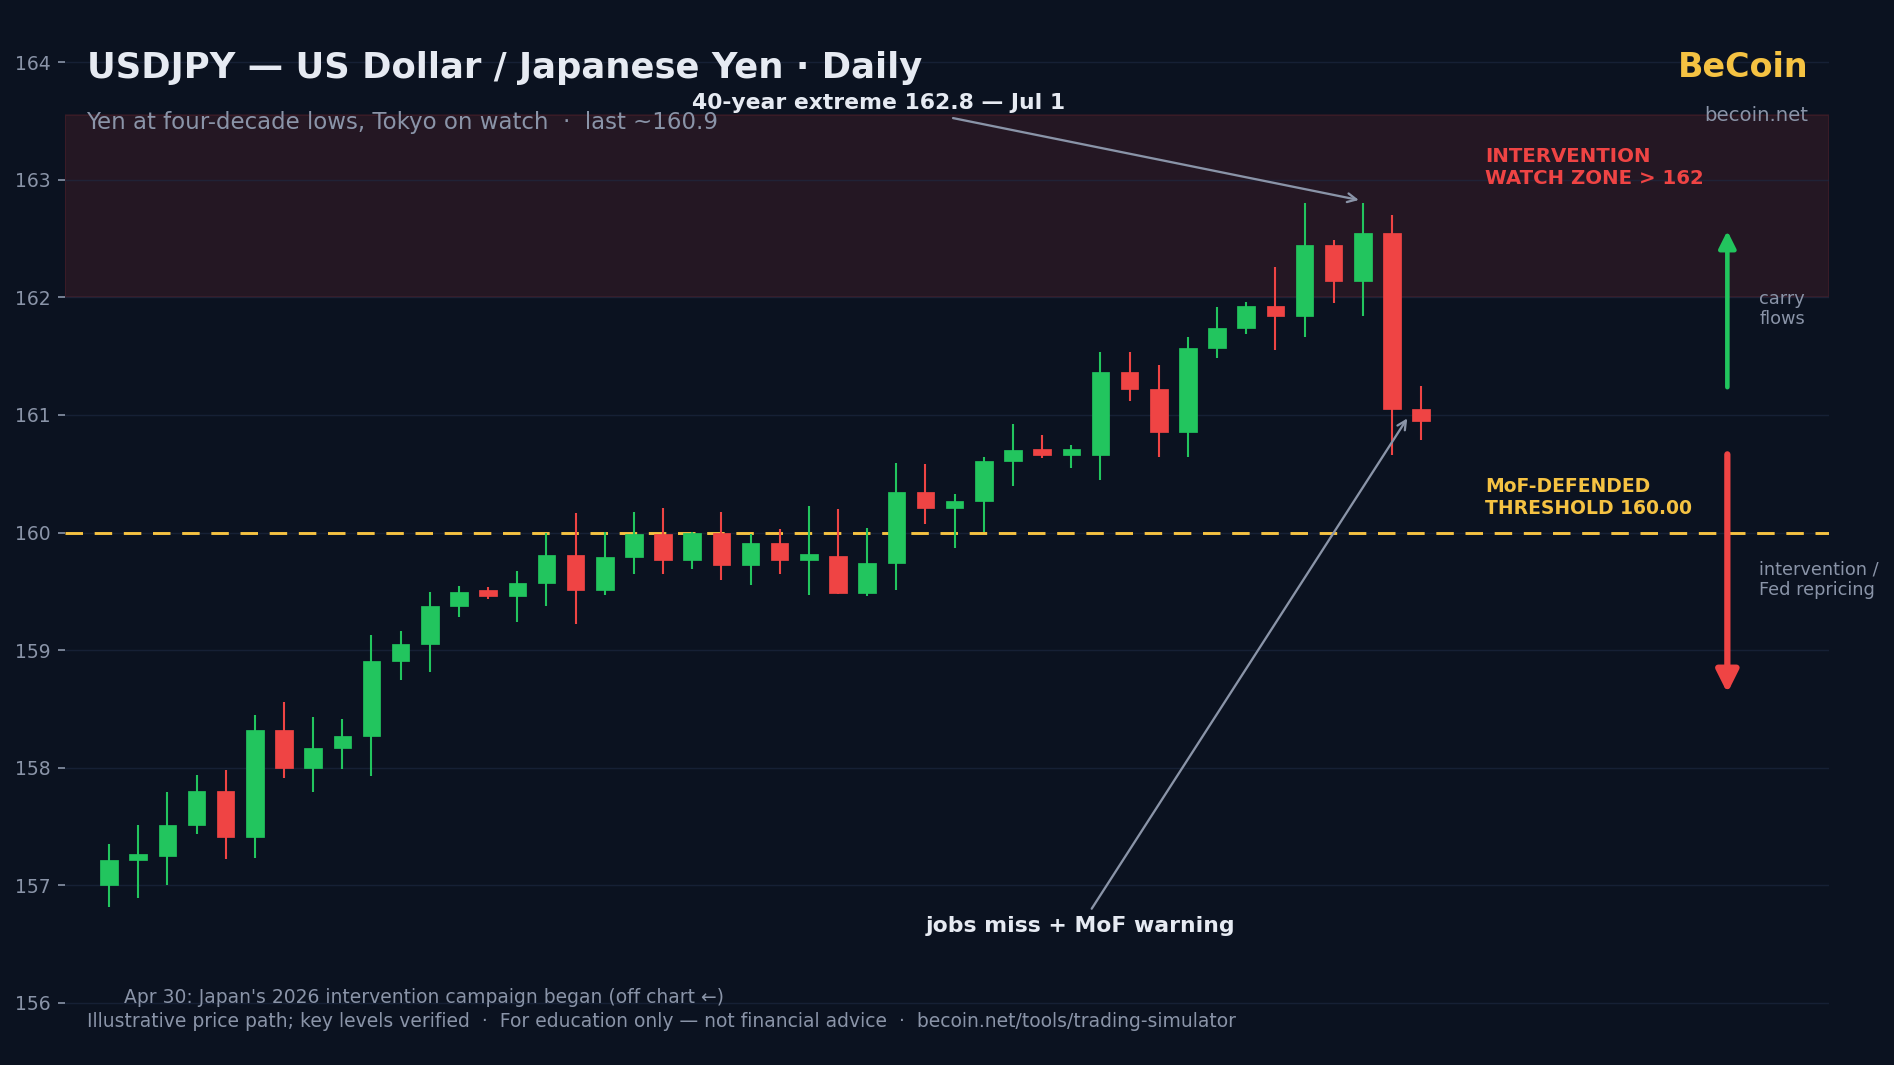
Yen at 40-Year Lows: Trading USDJPY Under Intervention Watch
USDJPY hit 162.8 — the yen's weakest in four decades — then snapped back below 161 on weak US jobs and fresh intervention warnings from Tokyo. Key levels, both cases, and what to watch.
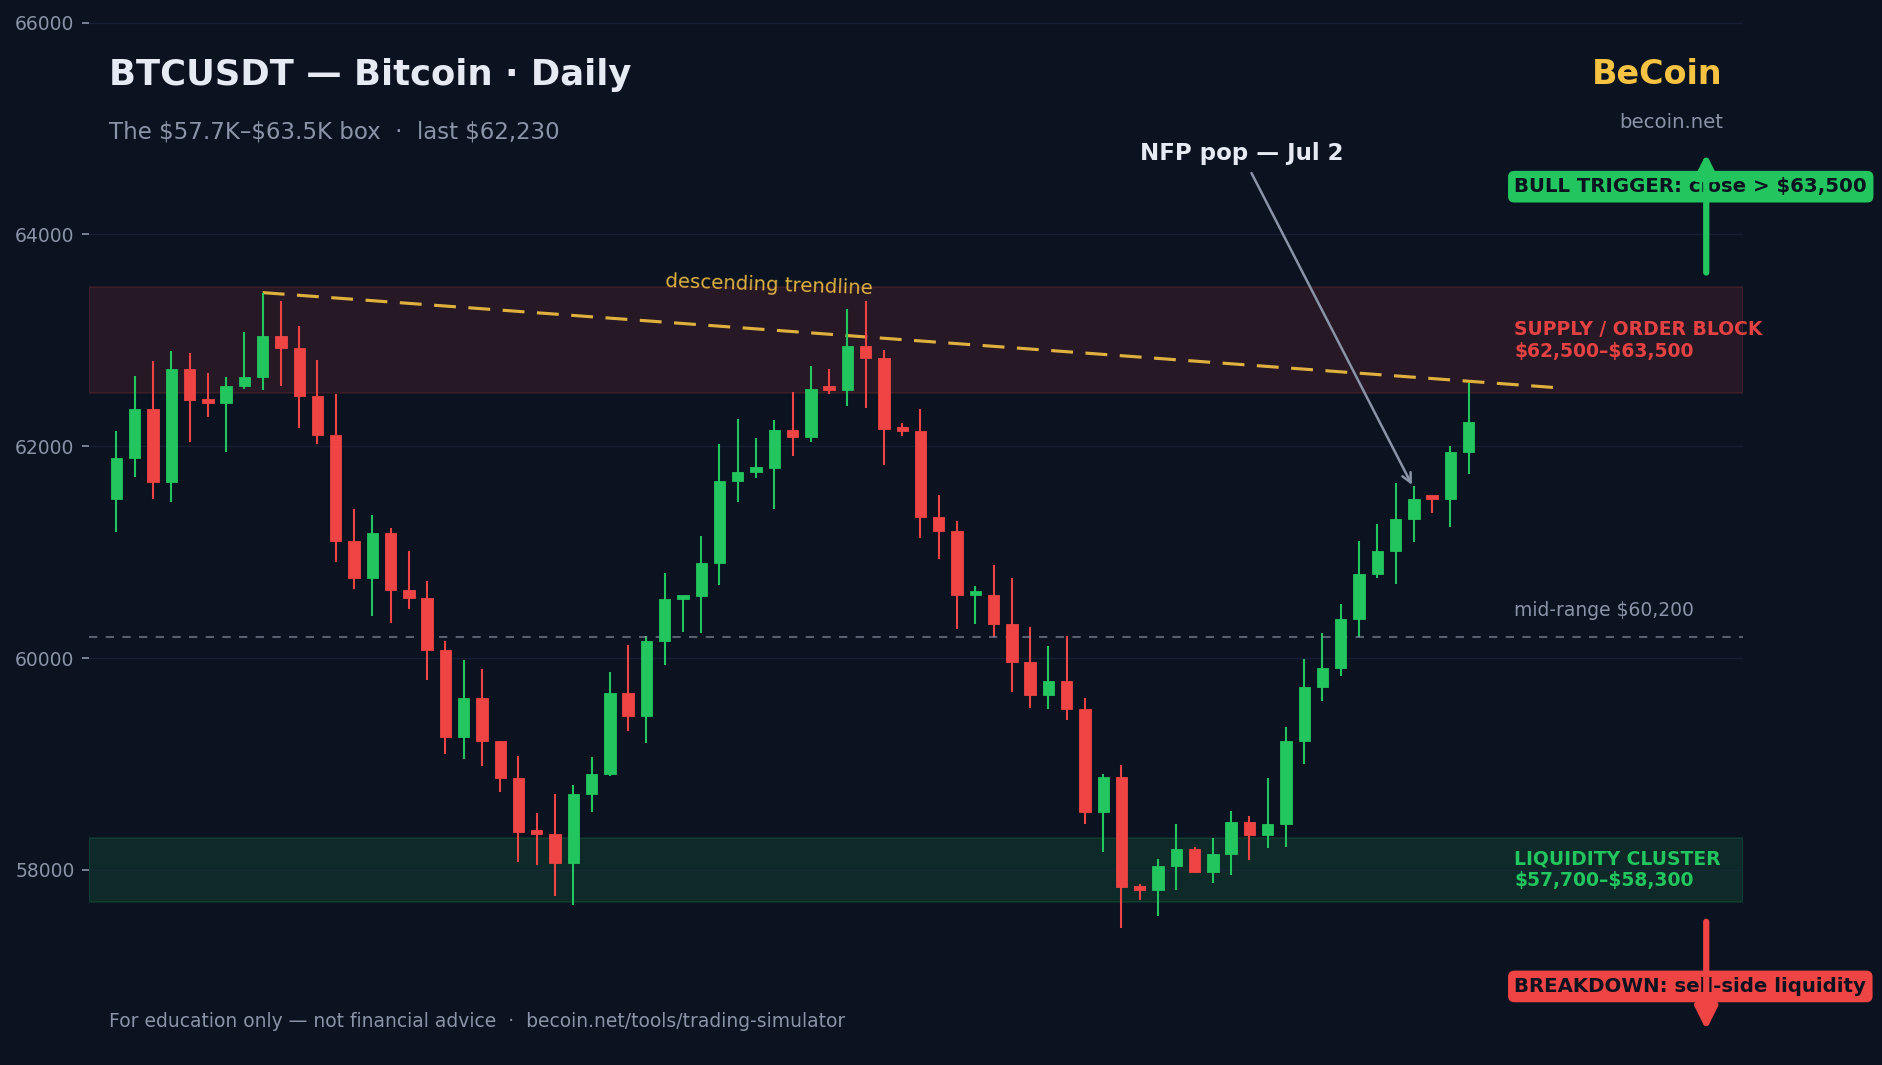
Bitcoin's $6,000 Box: The Levels Both Bulls and Bears Are Watching
Bitcoin is trading near $62K inside a $6,000 range both sides are watching. We break down the supply zone, the liquidity cluster below, both scenarios, and what confirms a real breakout.