Ethereum at Yearly Lows: Accumulation Zone or Value Trap?
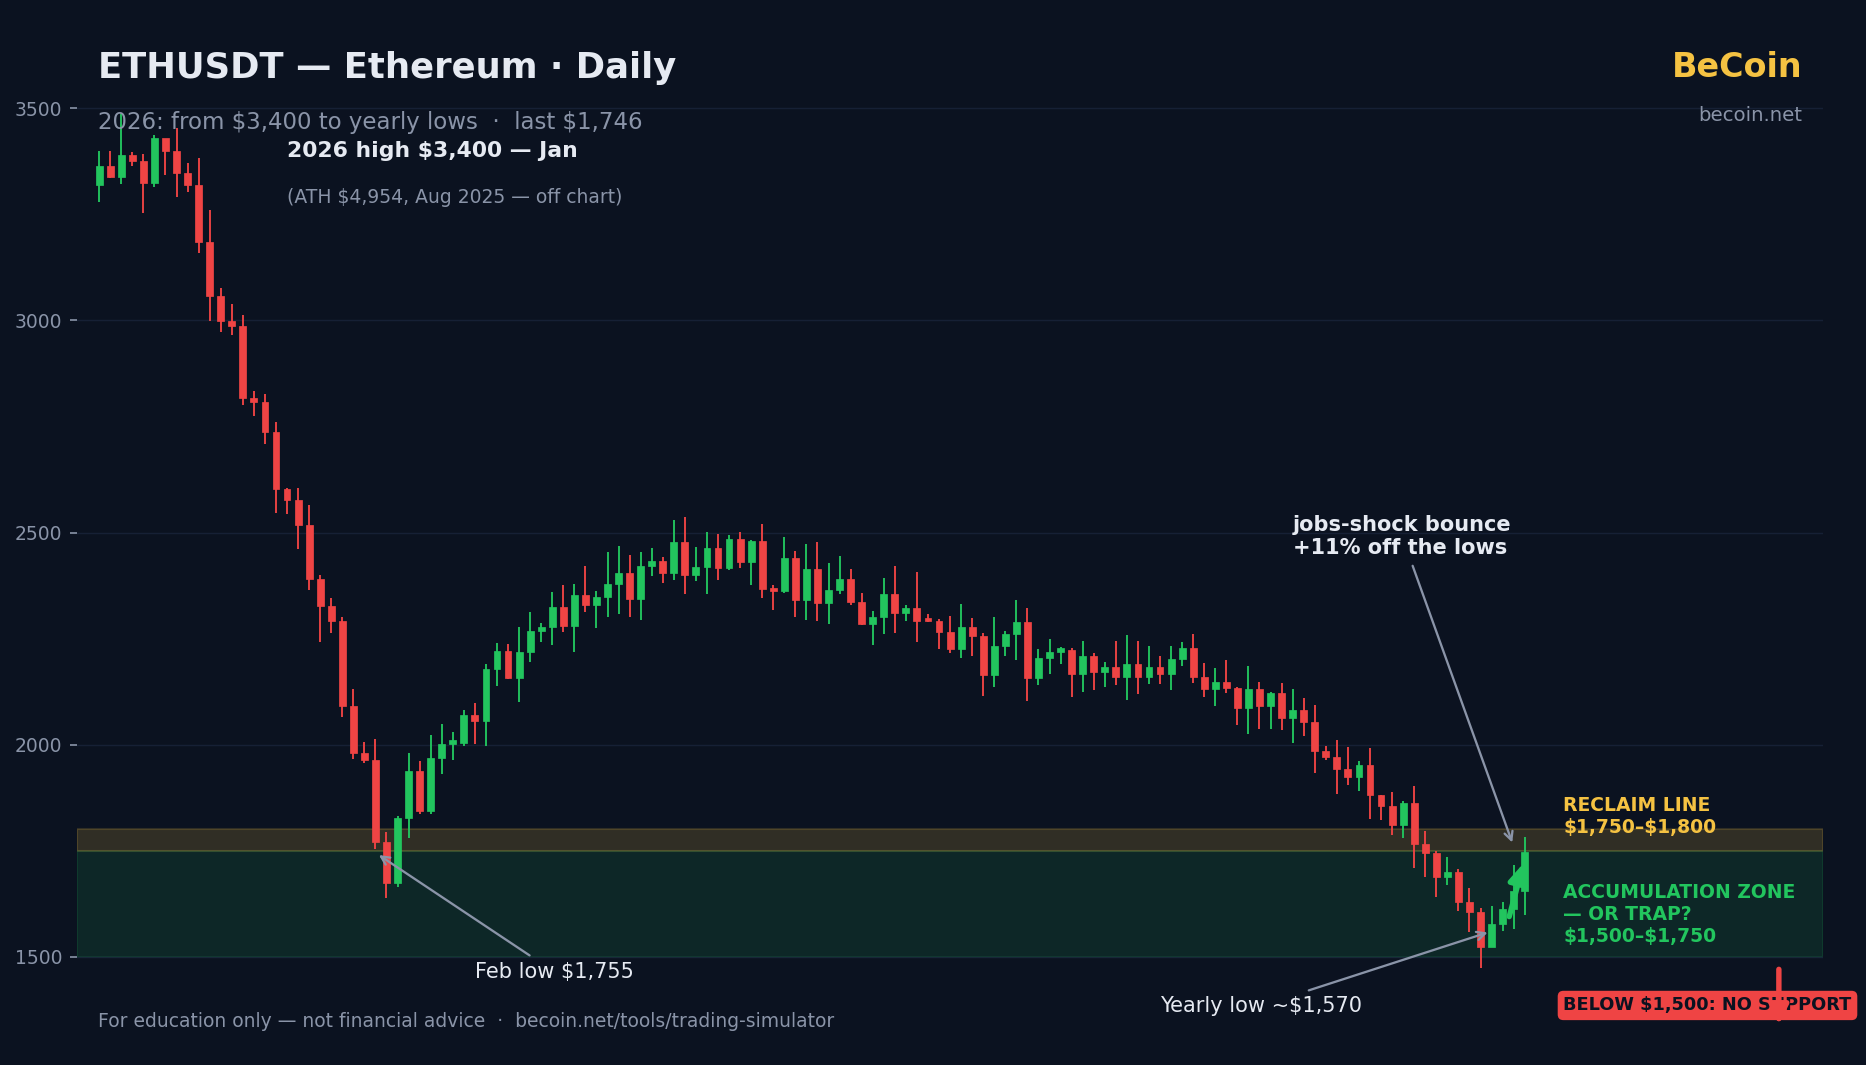
While Bitcoin argues about a $6,000 range near $62,000, Ethereum is fighting a much uglier battle. ETH entered July trading near $1,570 — its lowest levels in over a year — before bouncing to about $1,746 on July 3 as the weak US jobs report lifted the whole crypto complex. Even after that bounce, Ethereum sits roughly 65% below its August 2025 all-time high near $4,954, and the ETH/BTC ratio is scraping multi-year lows.
That combination — deeply depressed price, maximum pessimism, first signs of a bounce — is exactly the environment where "accumulation zone" and "value trap" arguments collide. Here is what the data actually says.
The Setup
Ethereum's 2026 has been a staircase down. The year opened with ETH near its January peak around $3,400; February brought a violent flush to roughly $1,755 before a partial recovery; and the second quarter turned into a slow bleed that accelerated in June, ending at fresh yearly lows near $1,570. By the numbers, ETH is down roughly 32% in 2026 against Bitcoin's roughly 11% decline — persistent underperformance, not a one-off shock.
The reasons are well documented. Spot Ethereum ETFs have seen sustained outflows while Bitcoin retained its institutional bid. ETH's high correlation to the Nasdaq (around 0.78, versus roughly 0.55 for BTC) makes it more sensitive to risk-off macro conditions. Value capture keeps leaking to Layer 2 networks, weakening the fee-burn story. Ethereum lacks the corporate treasury buyers that cushion Bitcoin drawdowns. And the Glamsterdam upgrade — the network's biggest protocol change since The Merge — was delayed from June to Q3, removing a key near-term bullish catalyst.
Then came July 2: a shock jobs miss, a softer dollar, and an 11% bounce off the lows in two sessions.
Key Levels to Know
- $4,954 — the August 2025 all-time high, the reference point for the full drawdown.
- $3,400 — the January 2026 peak; the level that separates "bear market rally" from "trend change" on the highest timeframe.
- $1,750–$1,800 — the immediate battleground. The February panic low (~$1,755) sits here, and ETH's July 3 bounce stalled almost exactly at it. Reclaiming this band turns the June breakdown into a potential false break.
- $1,500–$1,750 — the zone many longer-horizon traders are framing as an accumulation range while price holds inside it.
- ~$1,570 — the yearly low. Losing it puts ETH into territory it has not traded in over a year, with little recent structure below.
The Bullish Case
Accumulation advocates argue that the worst is priced in. ETH is down harder and longer than nearly every large-cap peer, sentiment gauges are depressed, and the macro wind just shifted: a cooling labor market and repriced Fed expectations weaken the dollar and historically favor risk assets. The delayed Glamsterdam upgrade has not been cancelled — it moved to Q3, meaning the catalyst is ahead, not gone. And the bounce itself matters: buyers showed up at yearly lows and pushed price straight back to the February low band within two sessions. If ETH reclaims $1,750–$1,800 and holds it, the June breakdown starts to look like a liquidity sweep rather than a trend continuation.
The Bearish Case
Value-trap proponents counter that cheap can always get cheaper, and Ethereum's problems are structural, not just cyclical. ETF outflows reflect an institutional preference that one soft jobs print will not reverse. The Nasdaq correlation cuts both ways — if equities finally get the correction many index traders are warning about, ETH is the high-beta casualty. The ETH/BTC downtrend has punished every dip-buyer for months, and the chart shows lower highs and lower lows all year, with the latest bounce stopping precisely at the first meaningful resistance. Until that changes, bears argue, this is a bear-market bounce inside a bear market — and a close below $1,500 opens a chapter with no recent support to lean on.
What Traders Should Watch Next
The $1,750–$1,800 band is the tell: acceptance above it flips the short-term structure, rejection keeps the downtrend intact. Watch spot ETF flow data for any sign the outflow streak is breaking — that, more than price, is the institutional scoreboard. The ETH/BTC ratio matters too: a bottoming ratio has historically preceded ETH's strongest runs, while new ratio lows warn that relative bleed continues. On the calendar, firm dates for the Glamsterdam upgrade in Q3 are the next network-specific catalyst. And as with everything this summer, US inflation and jobs data will keep setting the macro tone.
Conclusion
Ethereum at yearly lows is genuinely cheap by its own recent history and genuinely troubled by its own recent fundamentals — both things are true at once. The honest framing is conditional: the accumulation thesis earns credibility above $1,750–$1,800, and loses it below $1,500. In between, this remains one of the most disputed charts in crypto.
Form your own view — then pressure-test it. Test this setup in BeCoin's Trading Simulator: https://becoin.net/tools/trading-simulator — try accumulating the range, try shorting the failed bounces, and see which thesis survives contact with the tape.
Related: Bitcoin's $6,000 box and Solana's $80 supply-zone retest.
Risk note: This article is for information and education only and is not financial or investment advice. Cryptocurrencies are highly volatile, drawdowns can extend far beyond historical precedent, and the levels discussed here can become outdated quickly. Always do your own research and never risk money you cannot afford to lose.
---

NVIDIA Below $200: Healthy Pullback or Start of Distribution?
NVDA closed at $193.70, testing its 50-day moving average for the first time in two months as chip stocks sink. We weigh the healthy-pullback case against the distribution warning, level by level.
EURUSD Rebounds From One-Year Lows: Is the Dollar's Run Over?
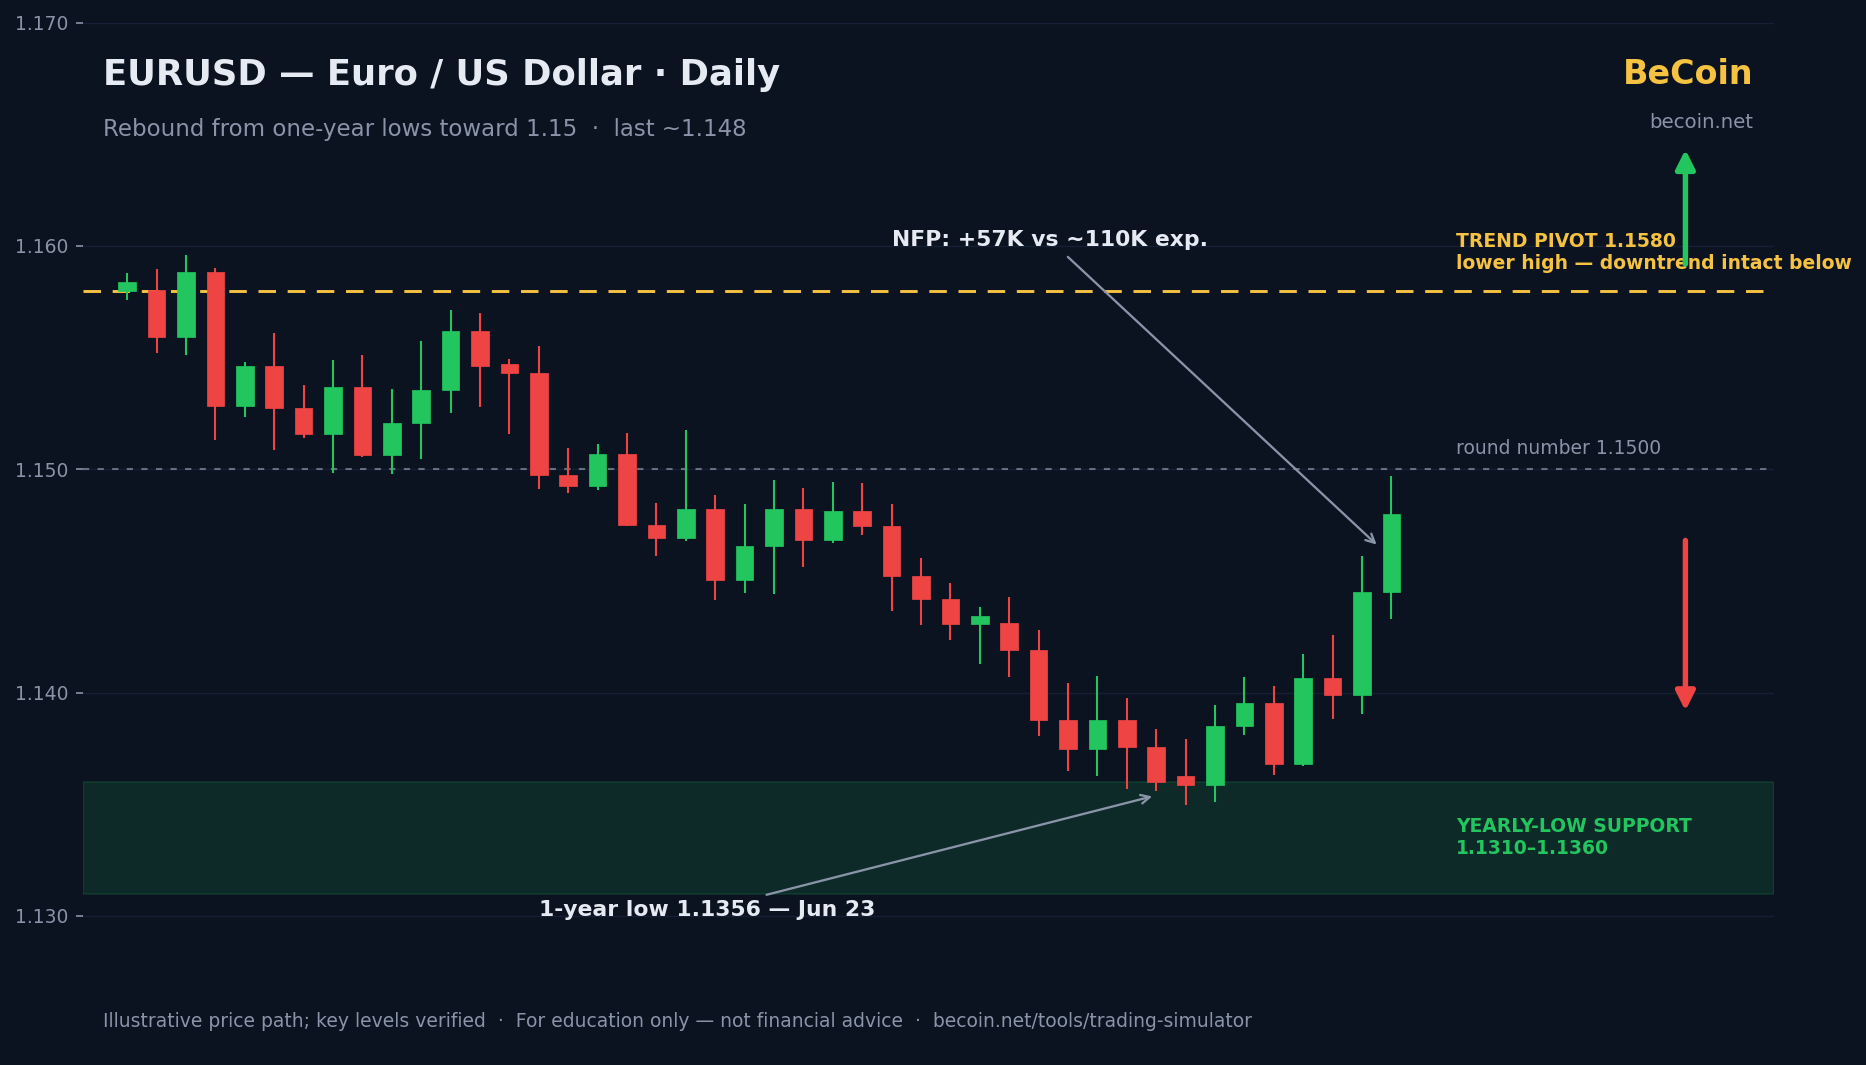
EURUSD bounced from its 1.1356 yearly low toward 1.15 after a weak US jobs report. We map the 1.1580 trend pivot, both scenarios, and what decides whether the dollar's run is over.
Gold Blasts Past $4,100 After Jobs Shock: Breakout or Trap?
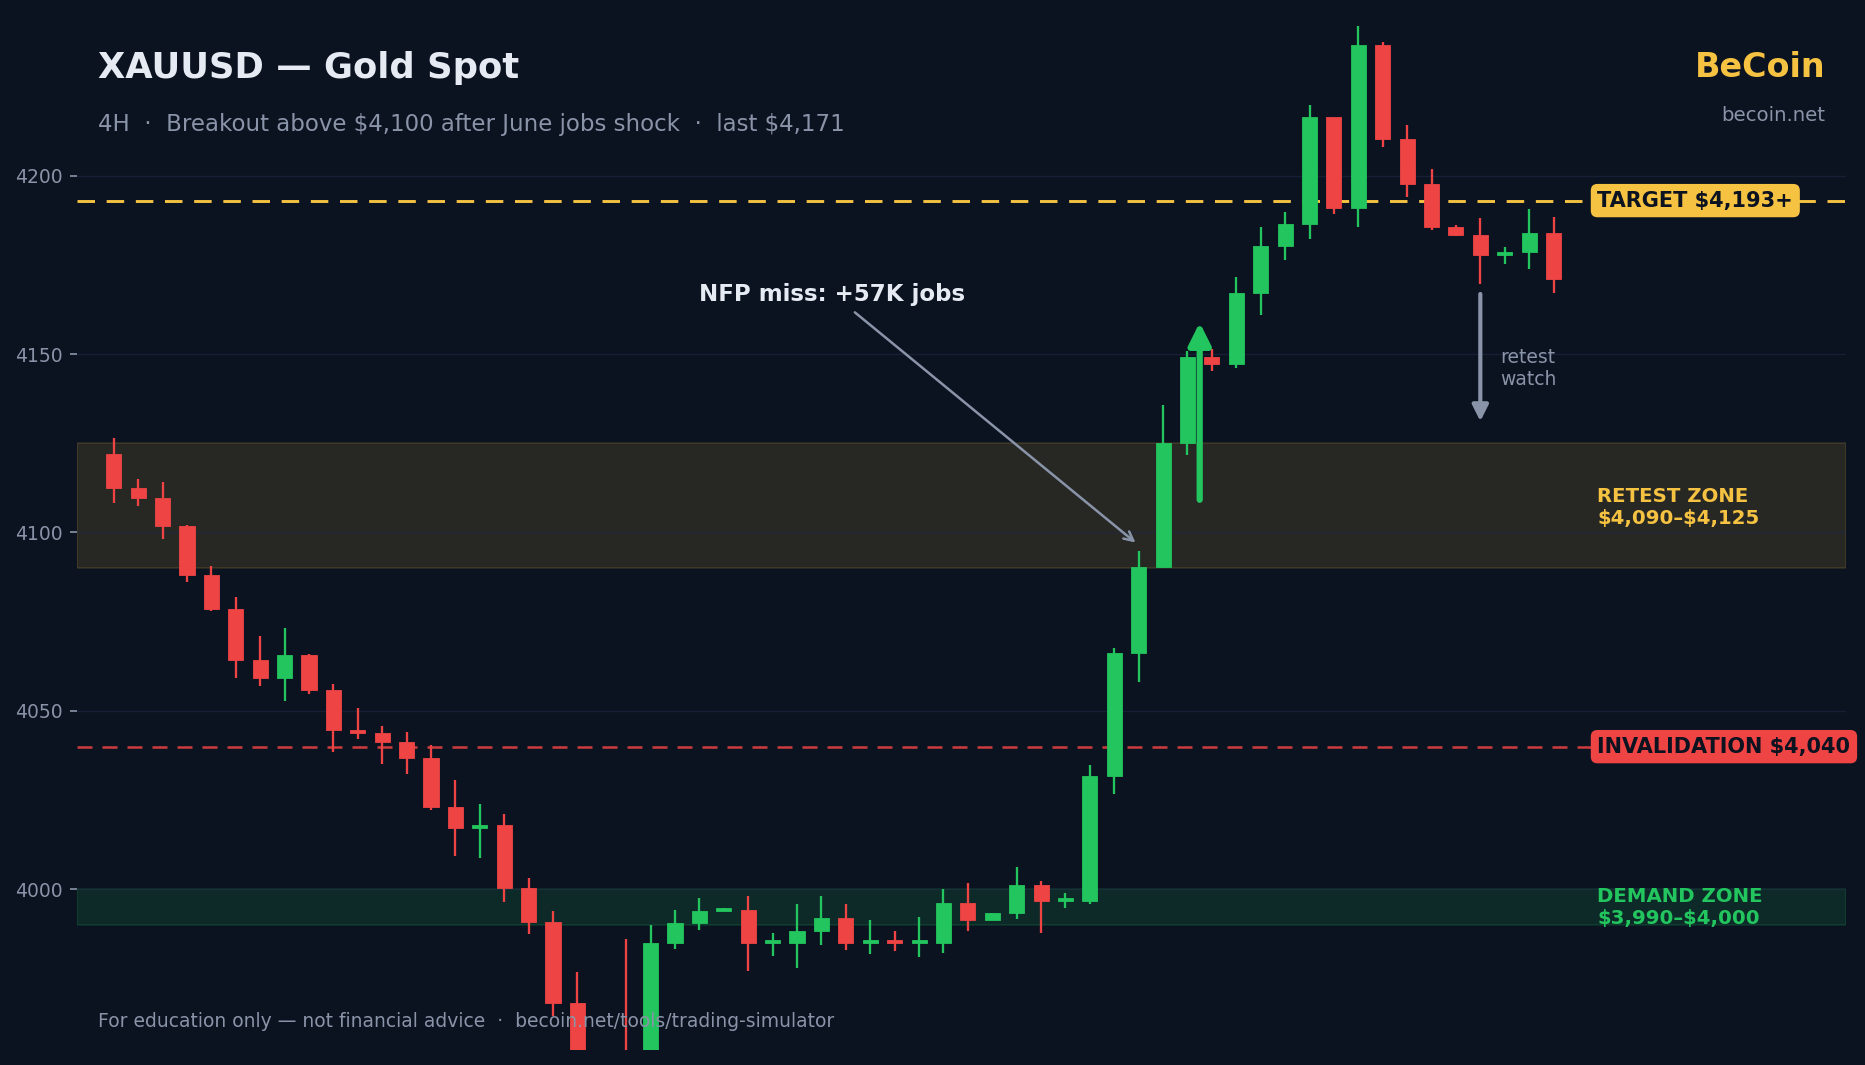
Gold surged past $4,100 after a shock US jobs miss. We map the key levels, the bullish and bearish cases, and what traders should watch next — plus how to practice the setup risk-free.
Yen at 40-Year Lows: Trading USDJPY Under Intervention Watch
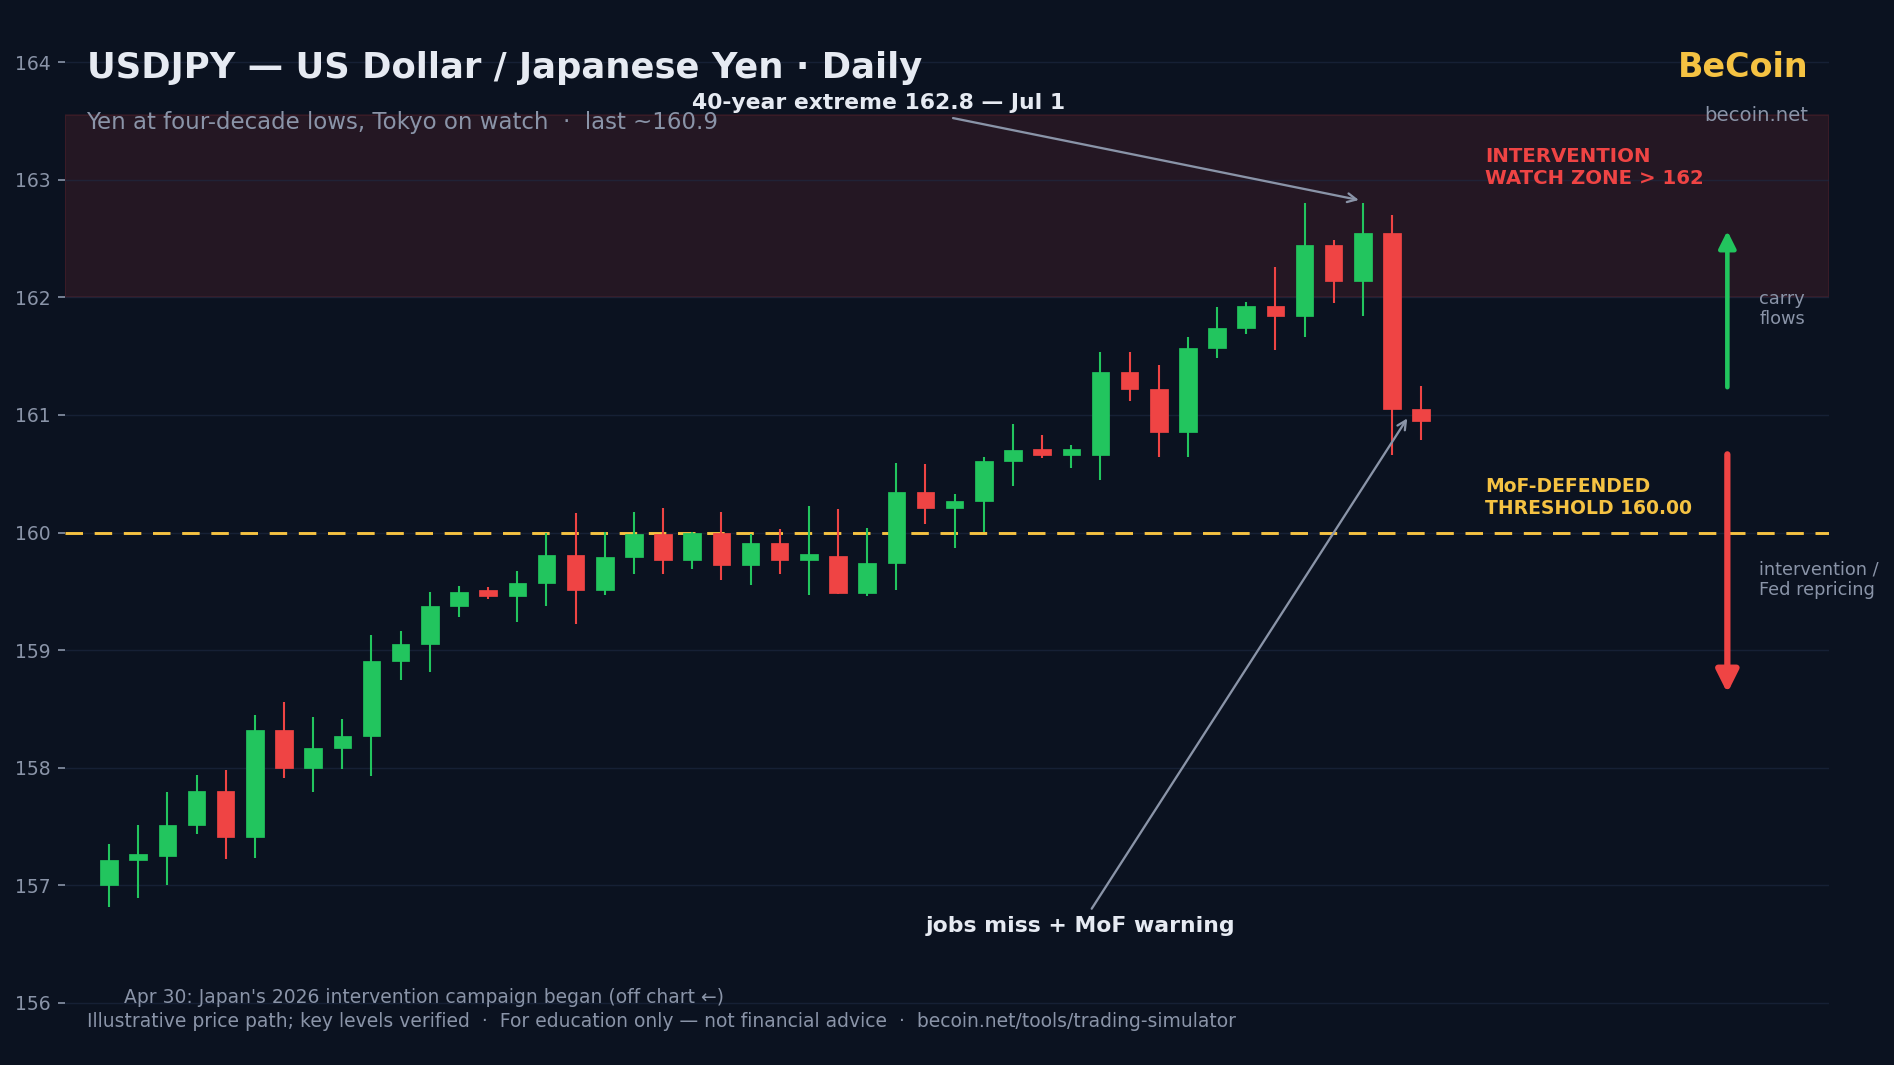
USDJPY hit 162.8 — the yen's weakest in four decades — then snapped back below 161 on weak US jobs and fresh intervention warnings from Tokyo. Key levels, both cases, and what to watch.
Solana's $80 Supply Zone: Why Traders Are Watching This Retest
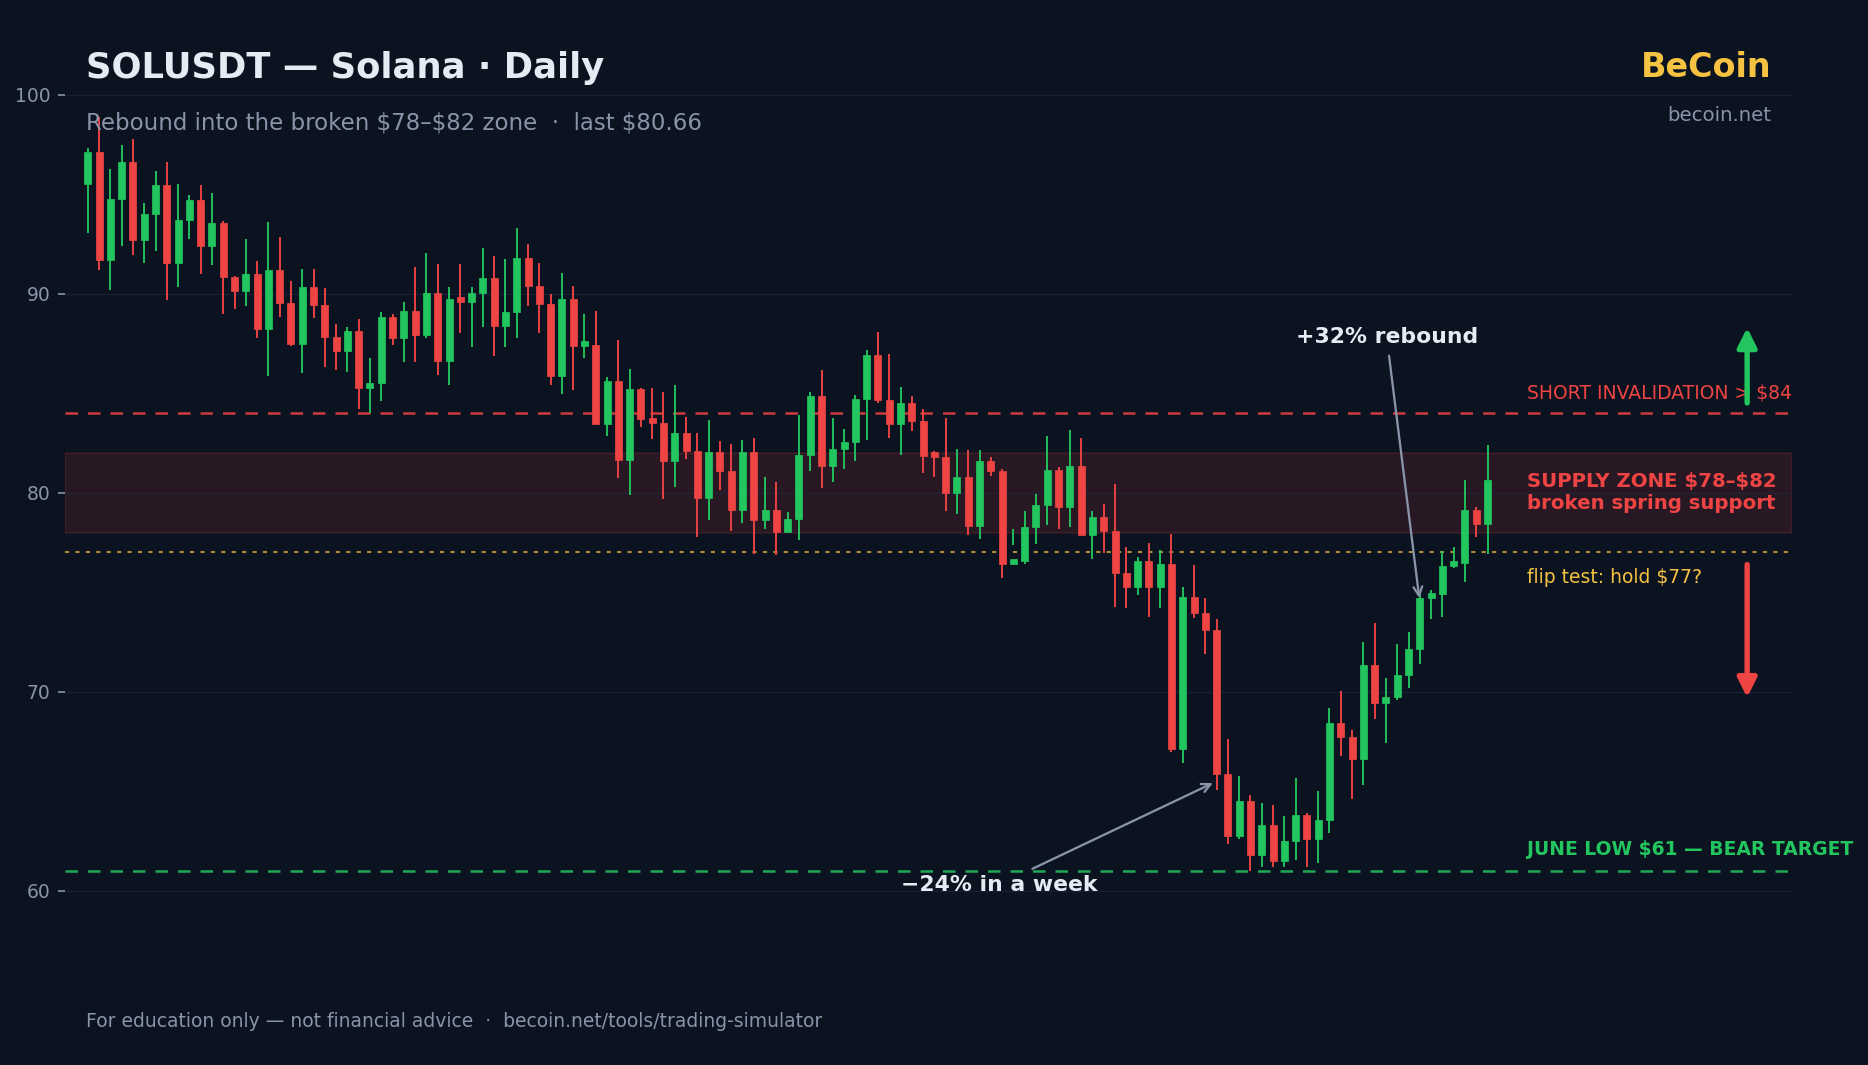
SOL rallied 32% off June's multi-year low near $61 straight into the broken $78–$82 support zone. We map the retest, the short thesis, the reclaim scenario, and the levels that decide it.
Bitcoin's $6,000 Box: The Levels Both Bulls and Bears Are Watching
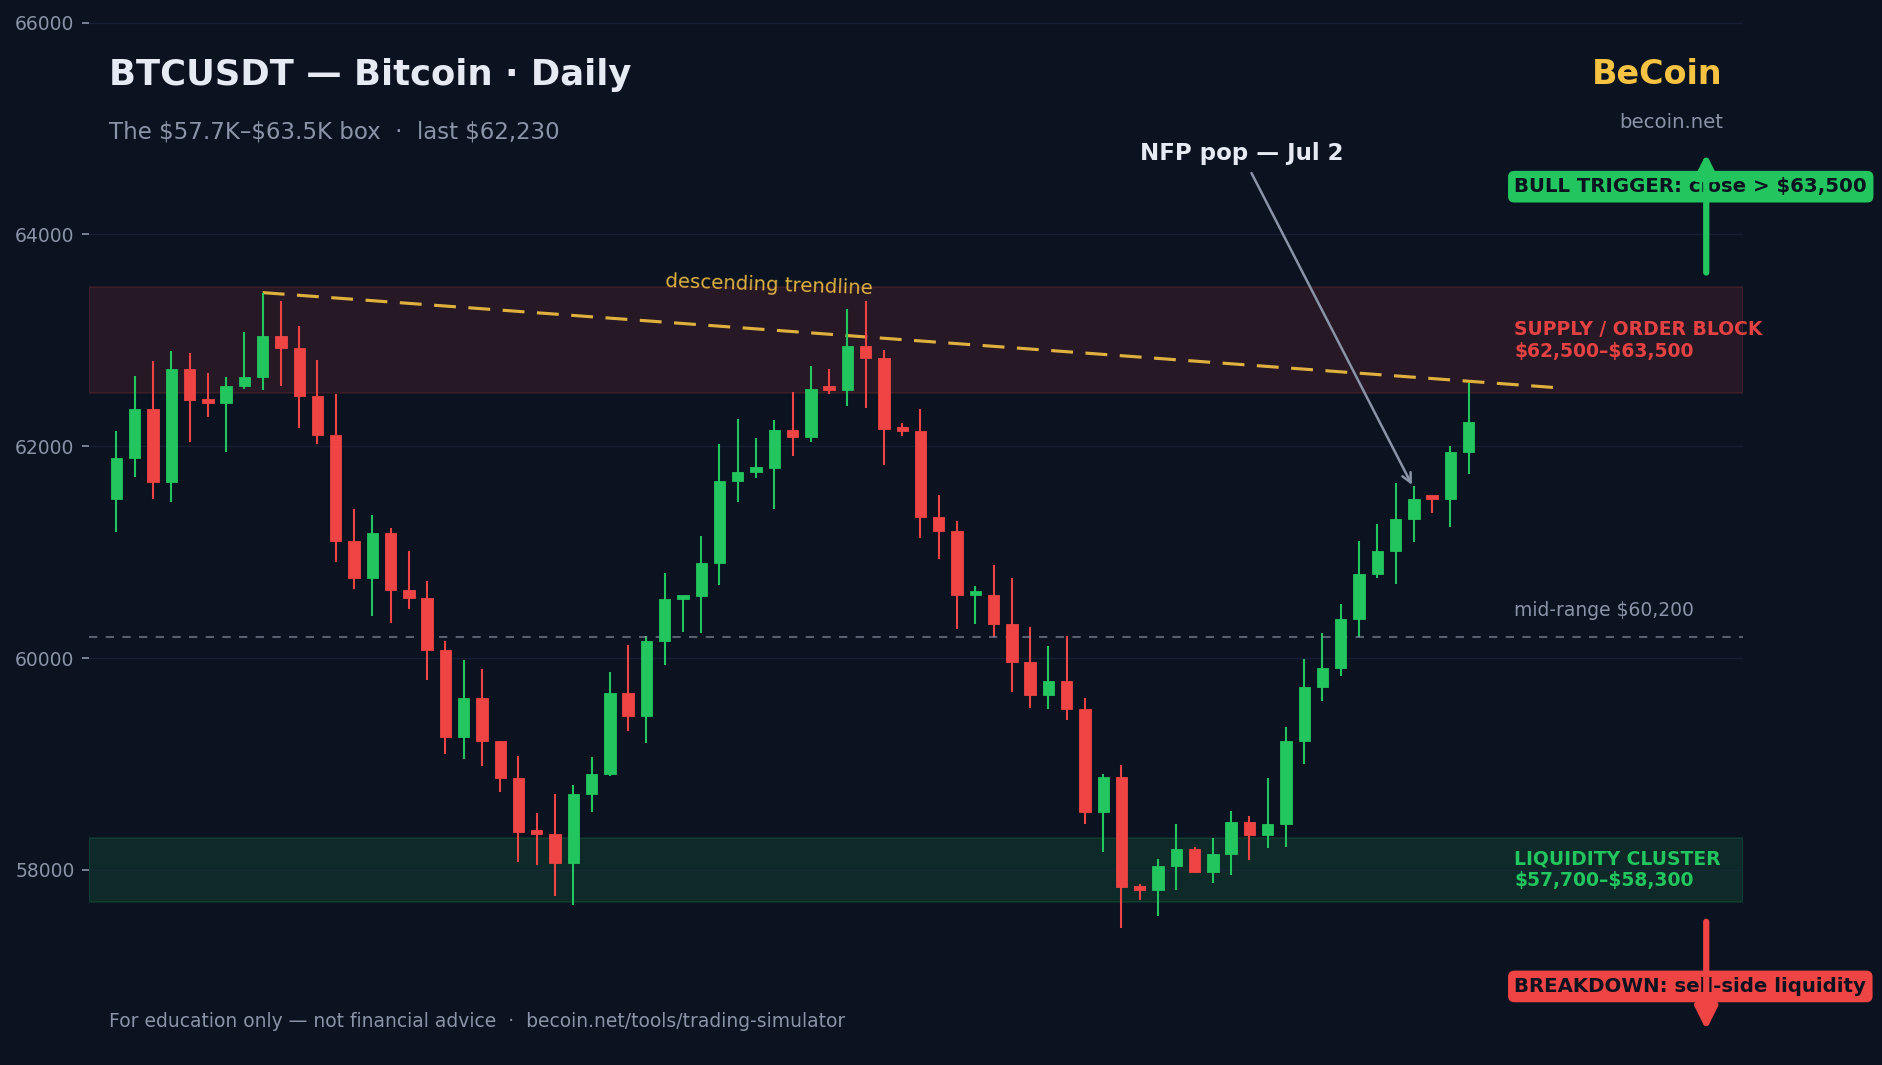
Bitcoin is trading near $62K inside a $6,000 range both sides are watching. We break down the supply zone, the liquidity cluster below, both scenarios, and what confirms a real breakout.